

1. Introduction
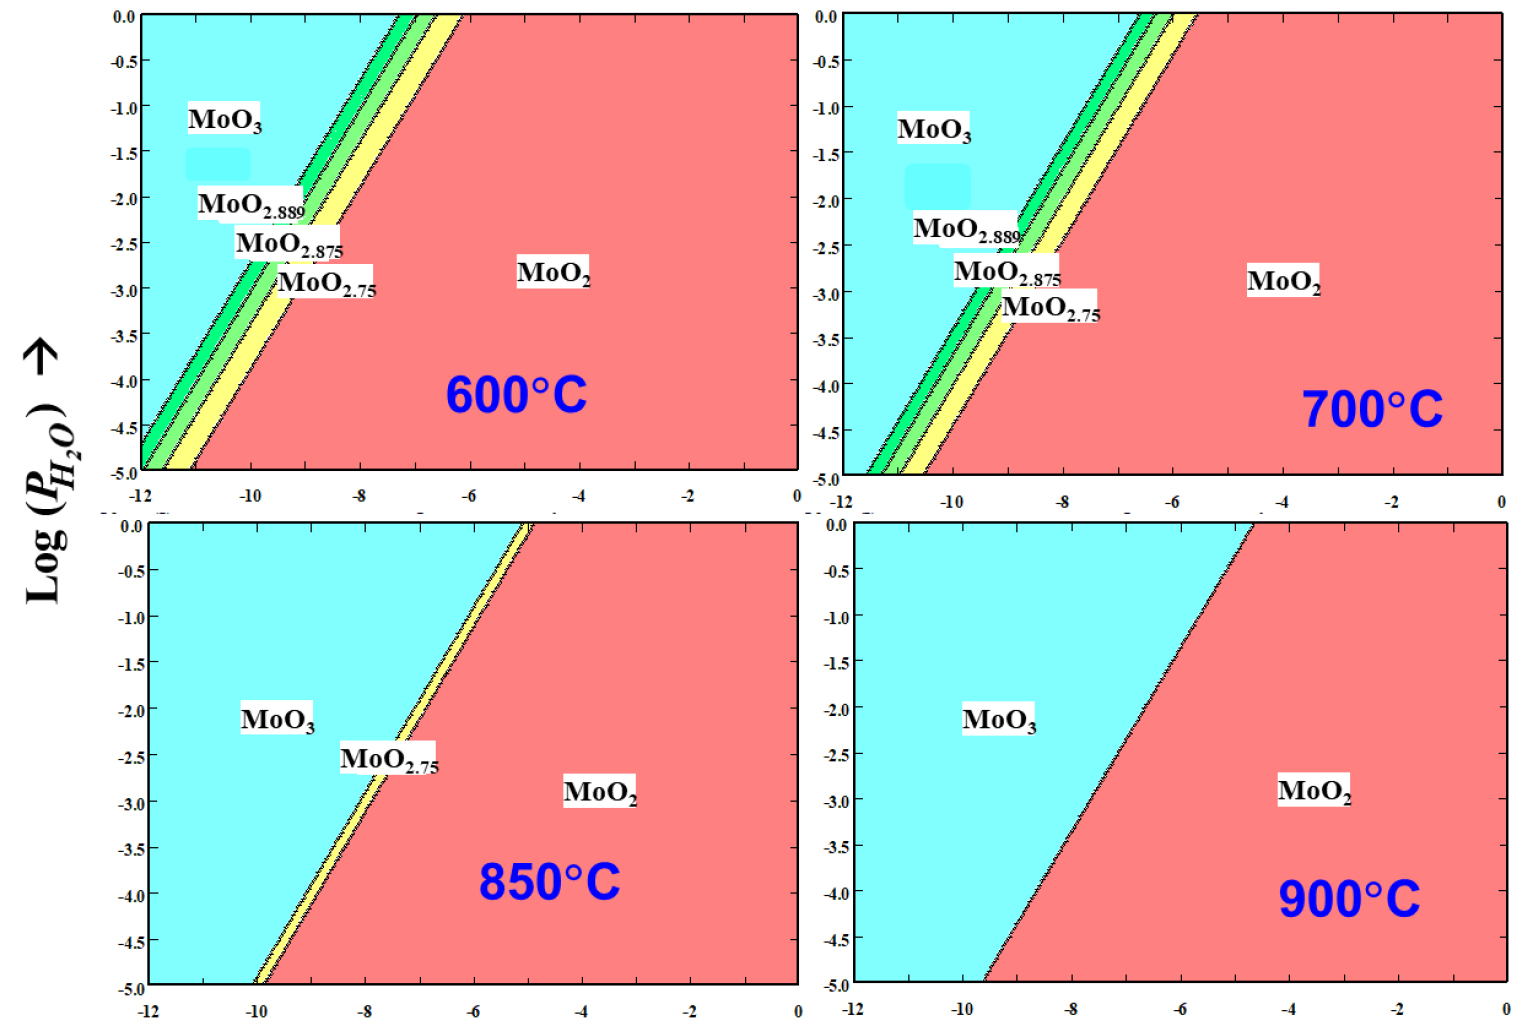
In the recycling of molybdenum-containing sources, the hydrogen reduction of molybdenum trioxide to molybdenum is the last step in producing molybdenum powders. Most of important properties of the resulting powder such as average grain size and specific surface area are determined by this step. The reduction of molybdenum oxide is necessarily carried out in two steps to prevent the melting and the sublimation loss of MoO3 at temperatures above about 600°C and to prevent the formation of coarse metal powder due to the presence of water vapor developed during the reaction1,2,3,4,5). In the first-stage, molybdenum trioxide is reduced at a temperature in the range of 500~550°C to produce molybdenum dioxide (MoO3 +H2 → MoO2 +H2O), and in the second-stage, the molybdenum dioxide is reduce to molybdenum in the temperature range of 750~900°C (MoO2 +2H2 → Mo+2H2O). For the first-stage, the direct reduction (MoO3-to-MoO2) had been considered in early times6,7,8), but the formation of Mo4O11 via the parallel reaction mechanism (comproportionation) of MoO3 and MoO2 (MoO3 + MoO2 → Mo4O11) has been reported in recent literature9,10), although its driving force is not explained by Gibbs free energy change. According to the data base of Outokumpu HSC Chemistry 5.11, three low-volatility intermediate oxides such as MoO2.889 (or Mo8O23), MoO2.875 (or Mo17O47) and MoO2.75 (or Mo4O11) can be formed during the first-stage reduction, and they disappear at temperatures above 900°C, as shown in the Fig. 1.
For the second-stage hydrogen reduction, a few of papers12,13,14) have reported on the reduction kinetics, but thought to be insufficiently studied.
In this study, thermodynamics, kinetics, and morphology of the two stage hydrogen reductions were investigated from a different standpoint, and the three aspects were compared between the two stages. The objective of this study is to obtain experimental data which could be effectively used in a commercial operation of the two stage hydrogen reduction process.
2. Experimental
High purity (99.9 wt%) MoO3 and MoO2 powders from Cisa, Japan were used in this study in the first and second-stages, respectively. The oxide powders were isothermally reduced by hydrogen gas using a horizontal tube furnace (ID 60 x L 1000). An alumina boat loaded with 10 gram of a sample was placed in the middle of the tube and the total gas flow rate was fixed at 1 L/min. In the first-stage, a mixed gas composed of 30 vol% H2 and 70 vol% Ar was selected for the reduction of MoO3, in the consideration of its high exothermic reaction. The temperatures range was from 550 to 600°C, and the residence time ranged from 30 to 150 min. In the second step, a pure H2 gas was used for the reduction of MoO2, and the ranges of temperature and residence time were from 700 to 750°C and from 30 to 150 min, respectively. The fractional conversion was calculated by a weight loss, and the phase change was characterized by X-ray diffraction (XRD, D/Max 2500, Rigaku, Japan) and scanning electron microscopy (SEM, S-2400, HITACHI, Japan).
3. Results and Discussion
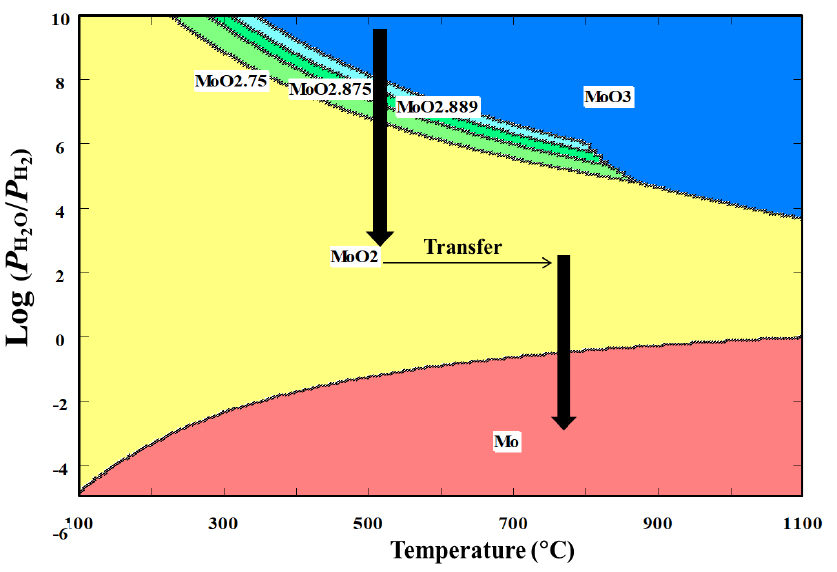
The isothermal stepwise process can be expressed as a route represented in Fig. 2, which was created using the software of Outokumpu HSC Chemistry 5.11. According to the figure, the intermediate oxides can exist at a temperature lower than around 870°C and at a partial pressure ratio of H2O to H2 higher than 105.
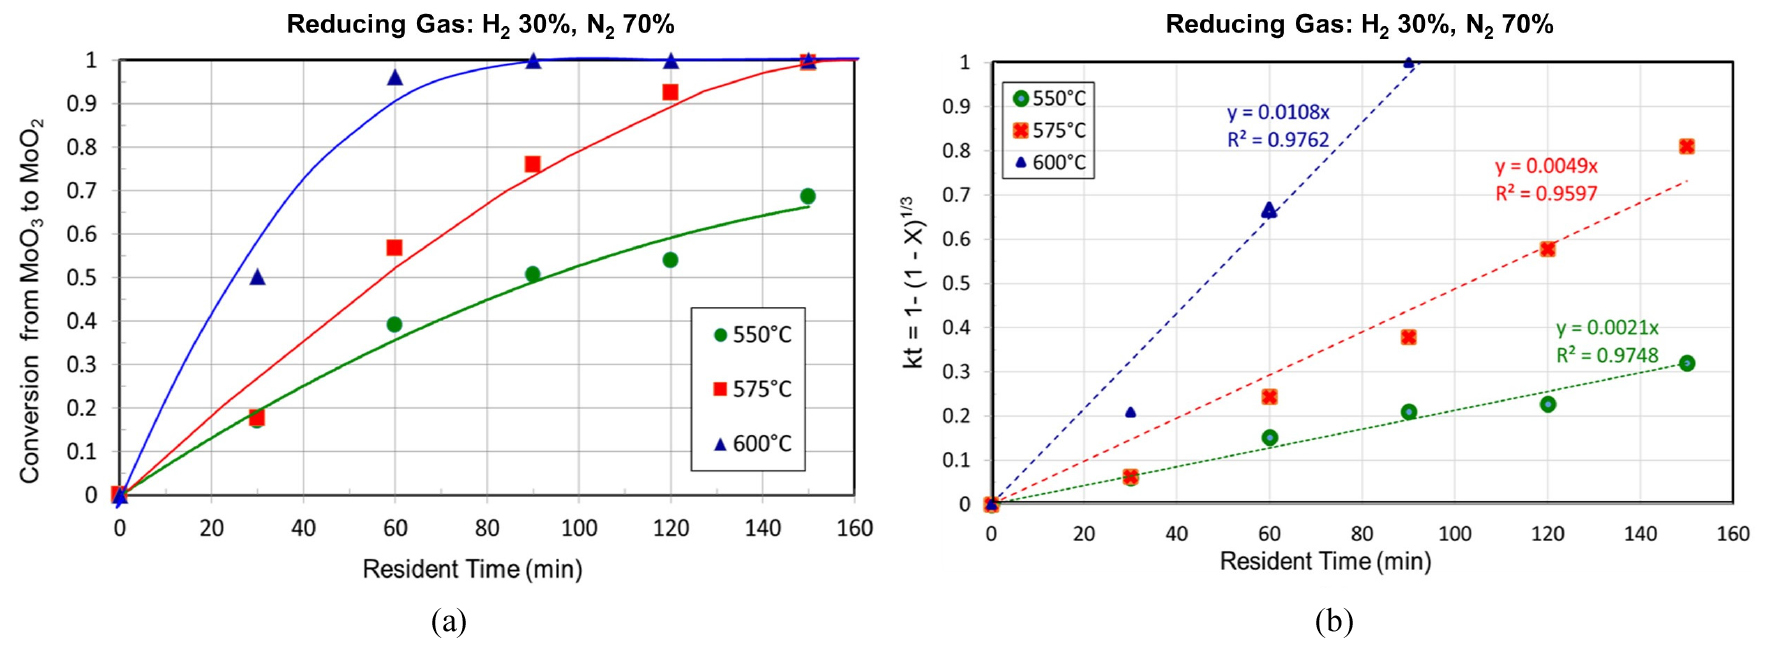
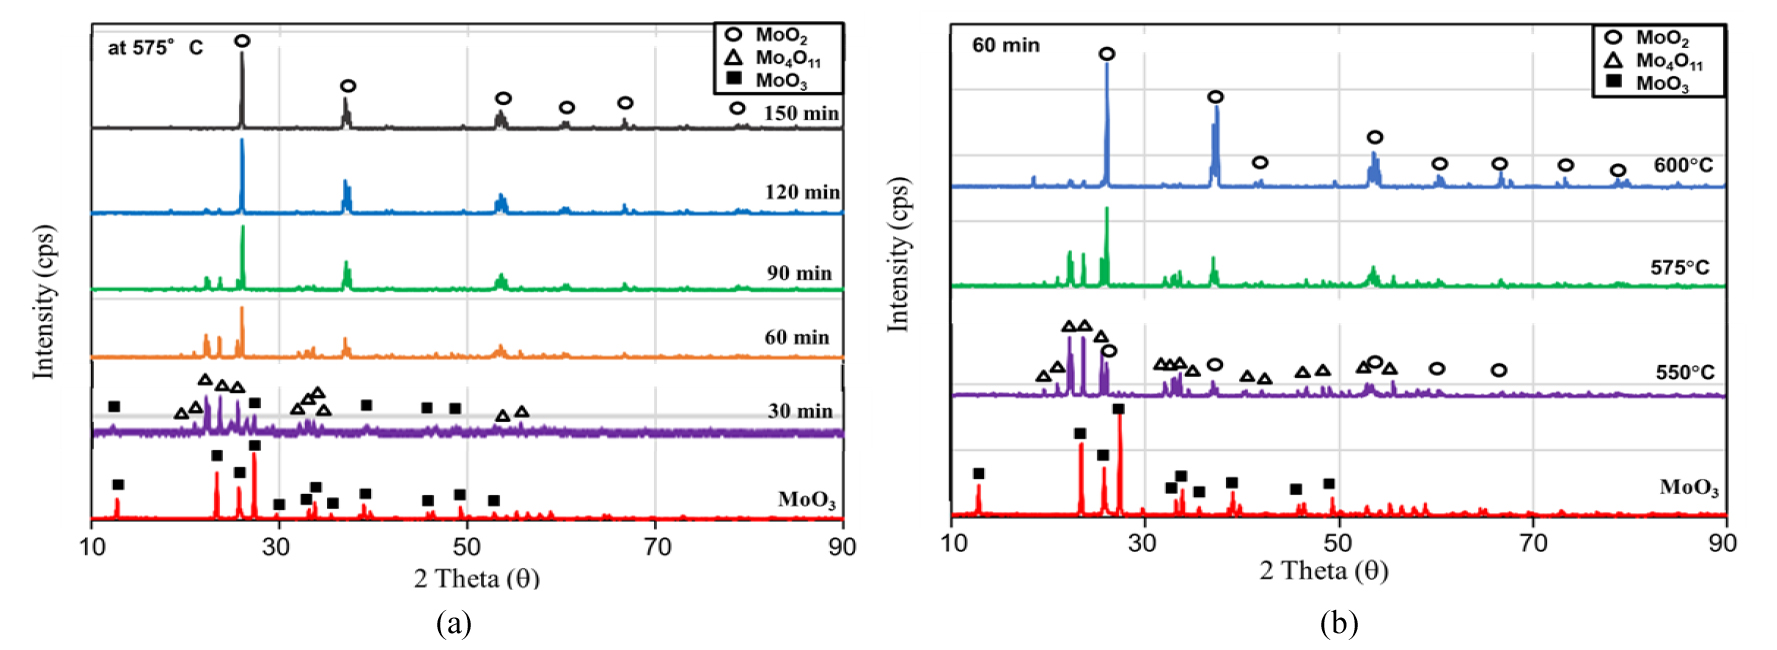
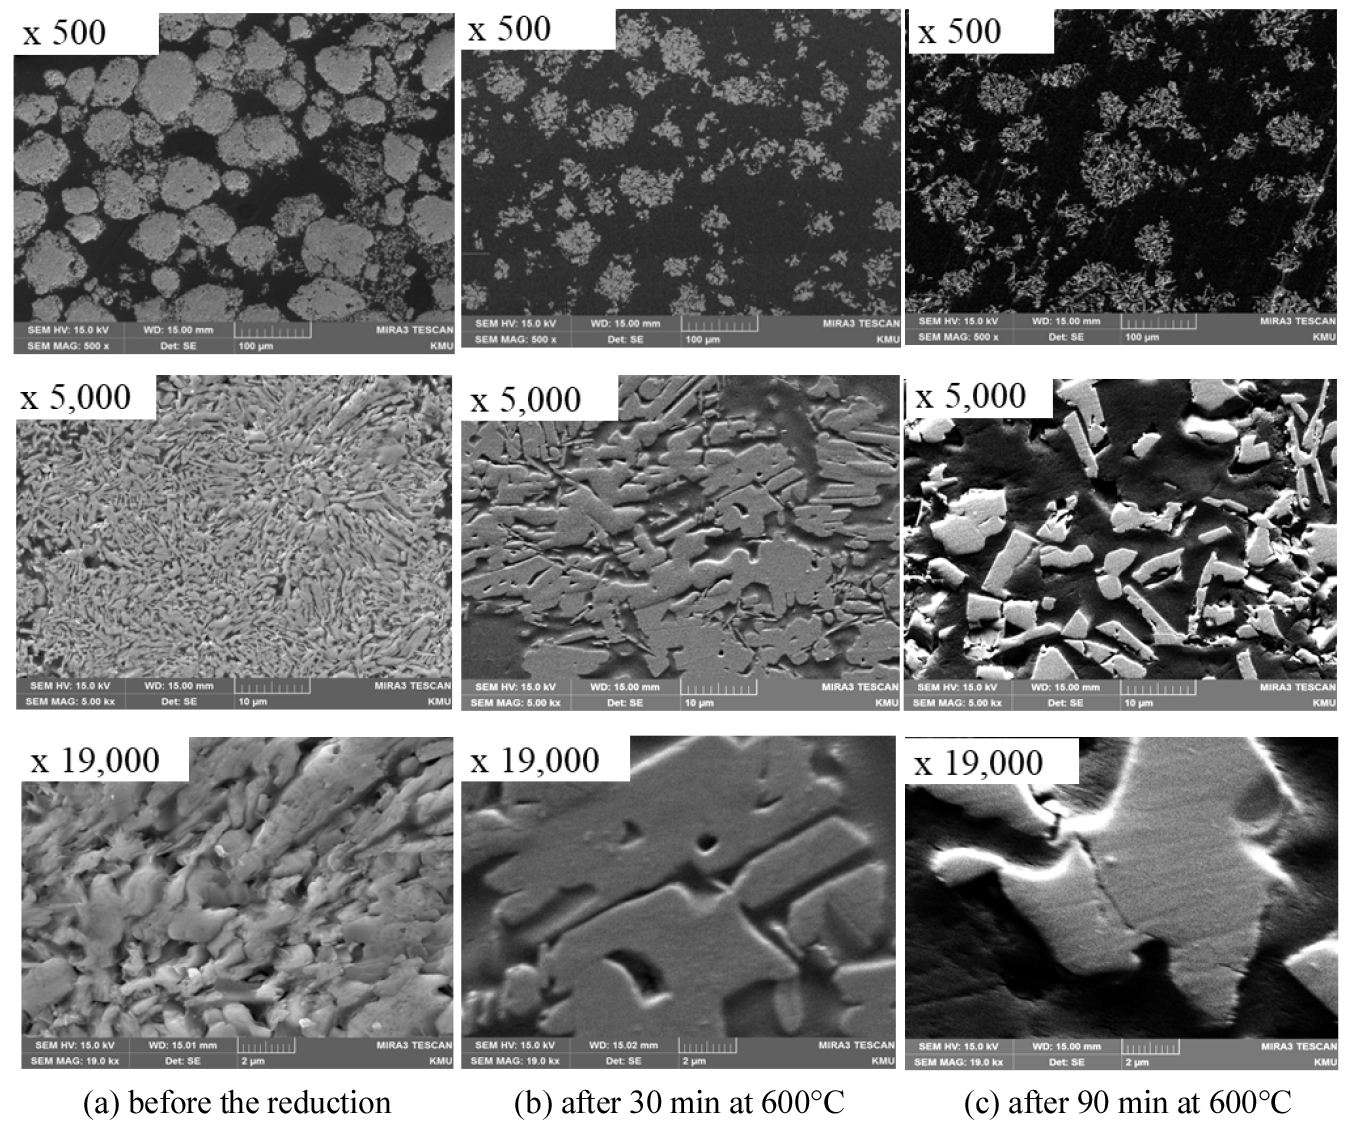
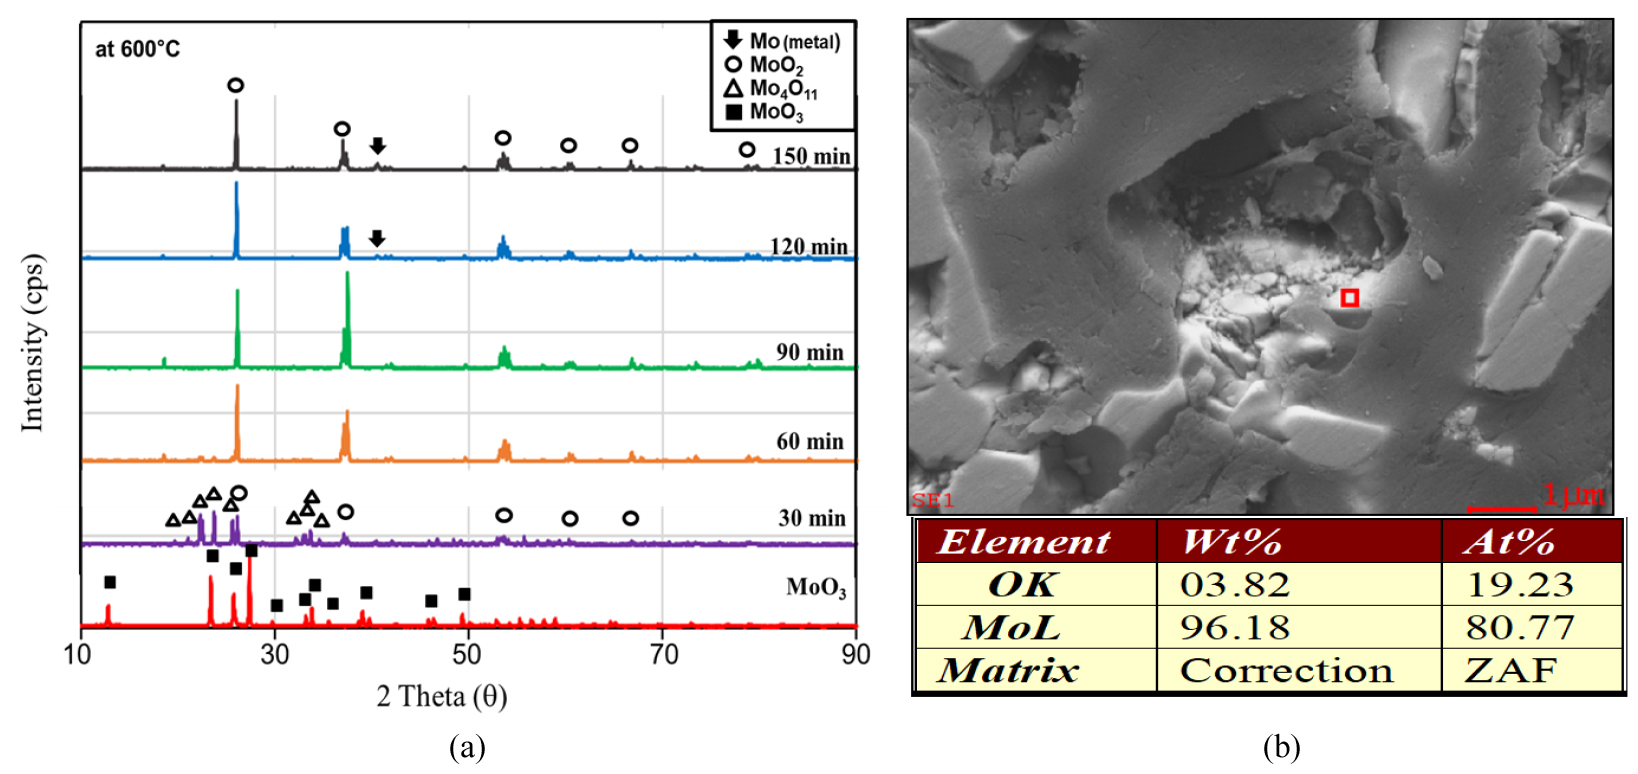
For the first-stage, the experimental results were represented in Figs. 3, 4, 5. The fractional conversions at different temperatures are shown in Fig. 3(a). A temperature dependence of reaction rate was observed, and the best curve fittings were obtained with a surface reaction control mechanism in spite of the presence of the intermediate oxides at the conditions of this study as represented in Fig. 3 (b). Based on this mechanism, the activation energy and the pre-exponential were calculated as 85.0 kJ/mol and 9.18x10⁷, respectively. The changes in XRD patterns are shown in Fig. 4. As can be seen in the figure, only Mo4O11 was detected as an intermediate oxide, and this phase disappeared at a temperature higher than 600°C or even at a lower temperature like 575°C with a long resident time. The formation of Mo4O11, however, seemed to have little effect on the reaction kinetics as can be seen in Fig. 3. Although the other intermediate oxides were not detected in this study, a similar rate-controlling step to that by Wang et al. was obtained11), and in their study CO−15 vol% CO2 mixed gases were used in the temperature range of 628−675°C. Fig. 5 shows SEM images of the MoO3 powder before the hydrogen reduction and after the reduction times of 30 min and 90 min at 600°C. As can be seen in the images, the pore size increased with the reduction time (i.e. with the conversion), which support the surface reaction control mechanism.
On other hand, metallic parts of molybdenum was overserved even in the first-stage reduction by hydrogen at 600°C at a reduction time longer than 120 min, as can be seen in the Figs. 6(a) and 6(b). This formation of metallic Mo, however, is not important because the formation rate is too slow to be meaningful in terms of a process concept.
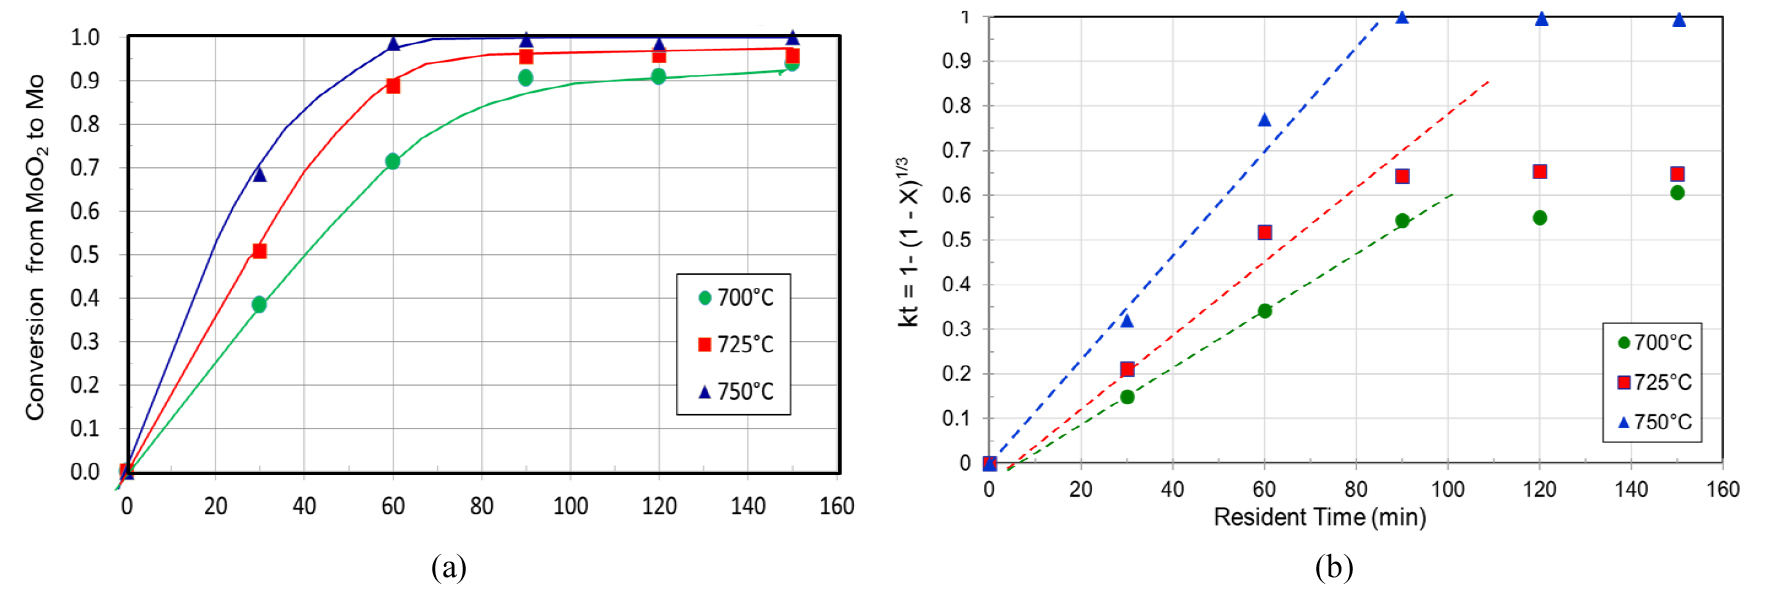
For the second-stage reduction, the experimental results were represented in Figs. 7, 8, 9. In this study, a high purity MoO2 of reagent grade was used, instead of the produced MoO2 from the first-stage of this study, to avoid any residual effect from the first-stage reduction. The fractional conversions at different temperatures are shown in Fig. 7(a). The temperature dependence of the reaction rate was also observed in the second-stage hydrogen reduction, but the surface reaction control mechanism fit only the early part of the second-stage reduction as represented in Fig. 7(b).
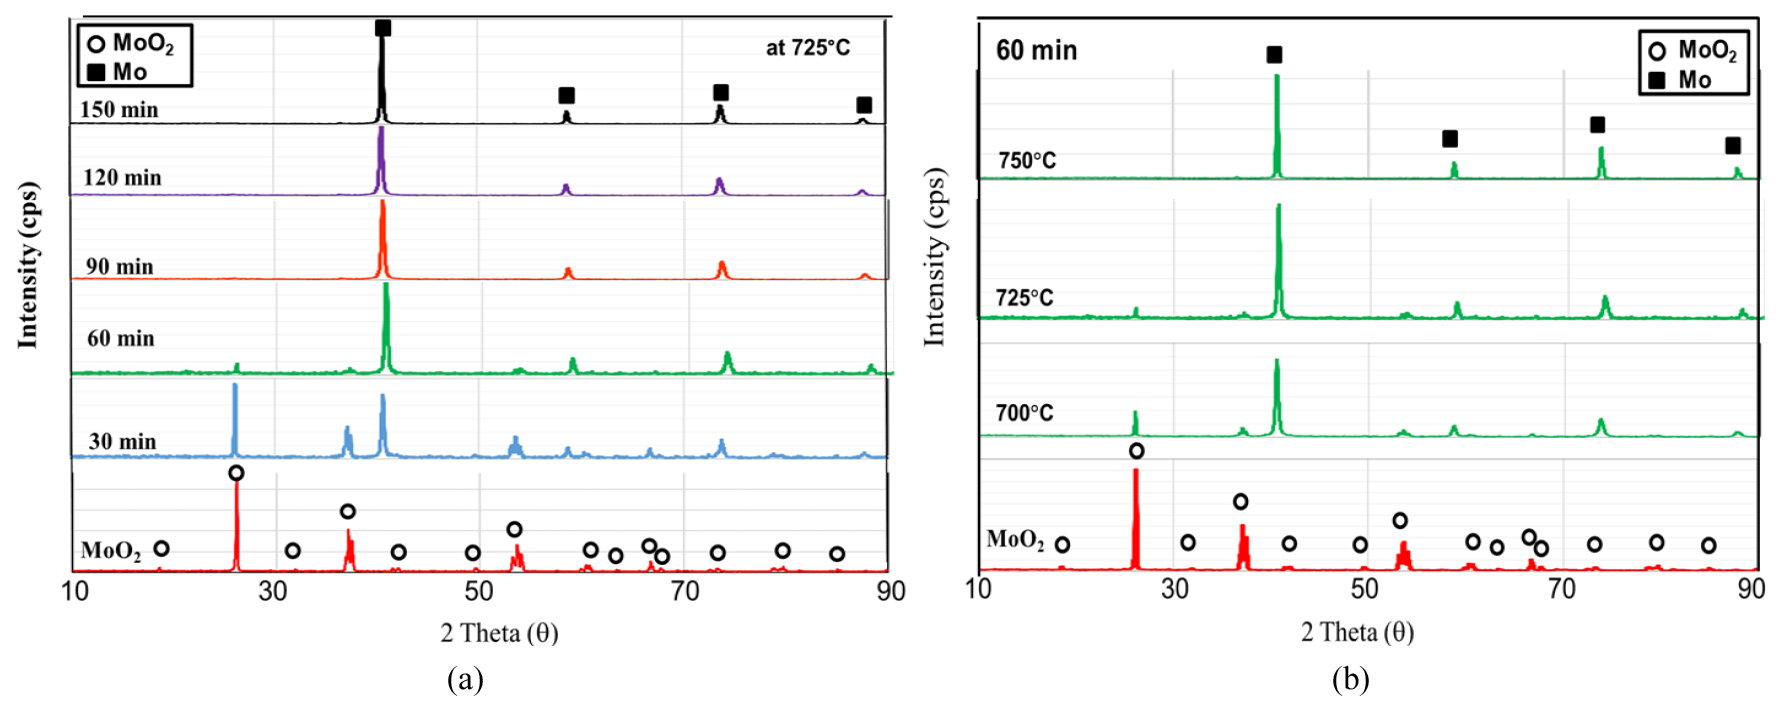
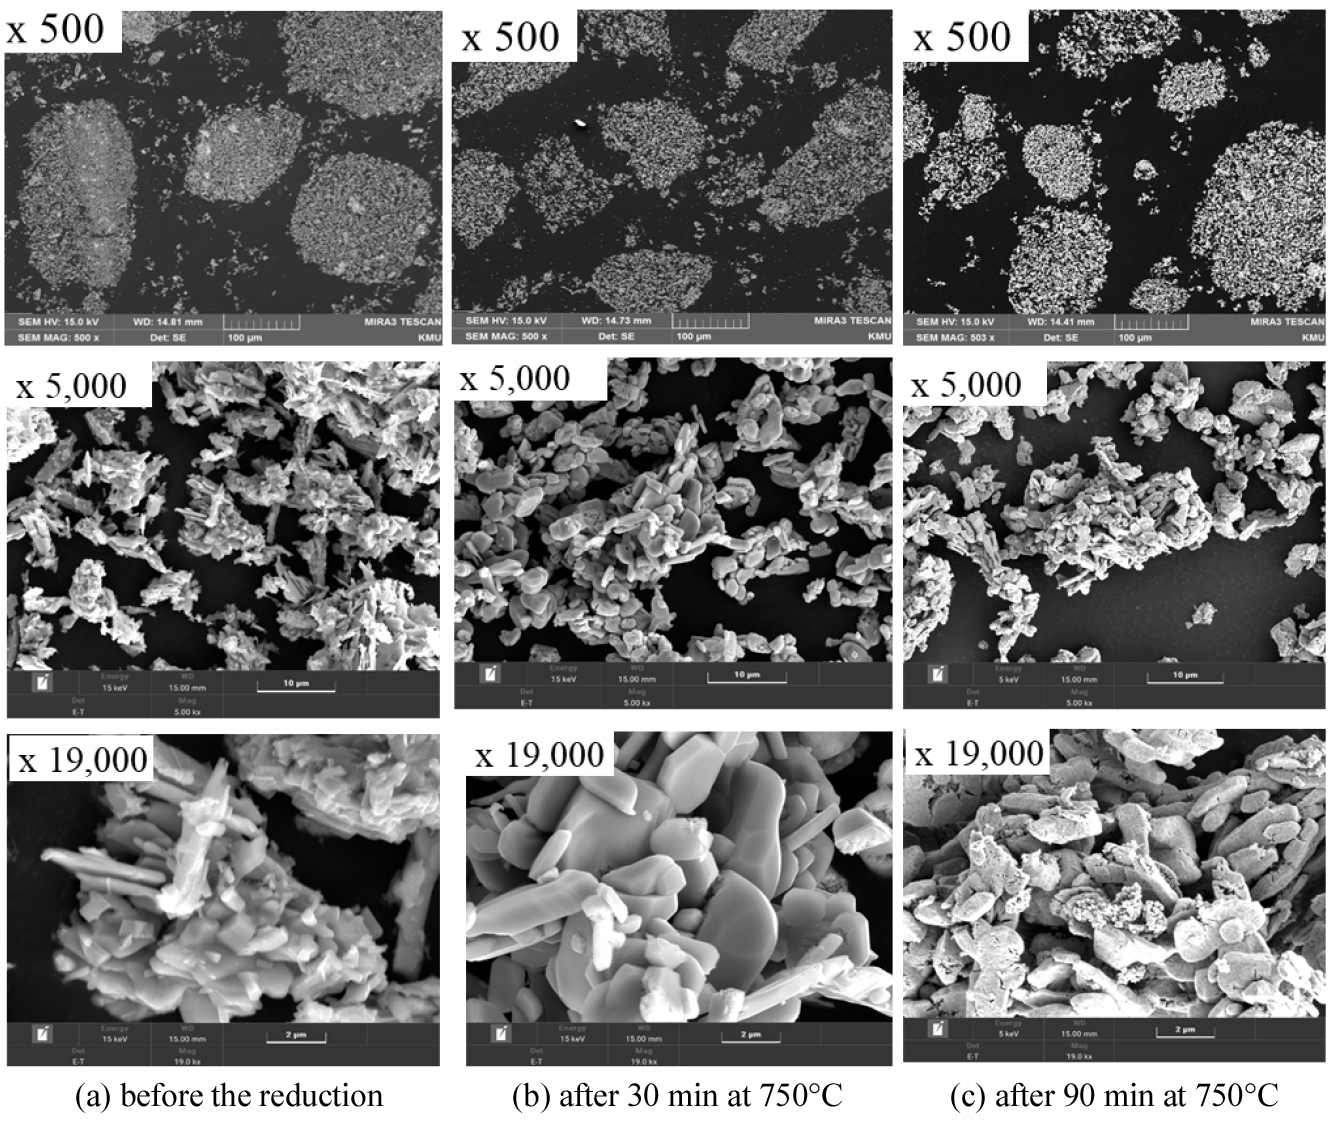
The changes in XRD patterns are shown in Fig. 8. As can be seen in the figure, MoO2 was completely reduced into metallic Mo at a high temperature above 750°C or at a lower temperature like 725°C with a long resident time. Fig. 9 shows SEM images of the MoO2 powders before the hydrogen reduction and after the reduction times of 30 min and 90 min at 750°C. As shown in the images, the morphologies were quite different from those observed in the first-stage reduction.
The original MoO2 powder was composed of many small platelet-shaped MoO2 particles. The platelet shape was broken as the MoO2 was reduced to metallic Mo, and when the MoO2 is completely reduced to metallic Mo, there were found to be many cracks and broken pieces, which resulted from the tension stress due to a volume change during the phase transformation, and this degradation may change the later part mechanism of the hydrogen reduction as can be seen in the Fig. 7b. This degradation was also reported by Dang et al.12), and a pseudomorphic transformation mechanism was introduced in their study.
4. Conclusion
Hydrogen reduction behaviors of molybdenum oxides were studied using a horizontal tube reactor. The reduction was carried out in two stages: MoO3 → MoO2 and MoO2 → Mo. The temperatures range was from 550 to 600°C, and the residence time range was from 30 to 150 min. In the second step, a pure H2 gas was used for the reduction of MoO2, and the ranges of temperature and residence time were from 700 to 750°C and from 30 to 150 min, respectively. The hydrogen reduction behaviors of the molybdenum oxides was found to be somewhat different between the two stages.
(1) For the first-stage, a temperature dependence of reaction rate was observed, and the best curve fittings were obtained with a surface reaction control mechanism, in spite of the presence of the intermediate oxides at the conditions of this study. Based on this mechanism, the activation energy and pre-exponential were calculated as 85.0 kJ/mol and 9.18x10⁷, respectively. In addition, the pore size within a particle was increased with temperature and residence time.
(2) For the second-stage, on the other hand, the temperature dependence of the reaction rate was also observed in the second-stage hydrogen reduction, but the surface reaction control mechanism fit only the early part of the second-stage reduction. Although this may be ascribed to cracks and broken pieces resulted from the volume change by the phase transformation from MoO2 to Mo during the hydrogen reduction, a more active research is planned to obtain a more clear reaction mechanism.
