

1. Introduction
2. Materials and Methods
2.1. Raw materials and sample preparation
2.2. Controlled cooling and measurement of cooling rate
2.3. XRD analysis and Rietveld refinement
2.4. Optical Microscopy
2.5. Machine Learning Approach Using Clinker Data
3. Results
3.1. Influence of Cooling Rate on Clinker Phase Grain Size
3.2. XRD quantitative analysis
3.3. Machine Learning–based prediction of compressive strength
4. Discussion
4.1. Effect of Cooling Rate on Phase Stability
4.2. Microstructural Evolution and Grain Refinement
4.3. Relationship Between Mineralogy and Strength
4.4. Optimal Cooling Range for Clinker Quality
4.5. Industrial and Sustainability Implications
4.6. Integration of Machine Learning and Process Design
5. Conclusion
5.1. Effect of Cooling Rate on Phase Stability and Microstructure
5.2. Correlation Between Mineralogy and Mechanical Performance
5.3. Industrial and Scientific Implications
1. Introduction
Portland cement is the most widely used construction material in the world, and its demand continues to grow with expanding infrastructure development. The properties of Portland cement are primarily governed by the mineralogical and microstructural characteristics of its clinker, which forms when a raw meal containing calcium, silicon, aluminum, and iron oxides sintered at approximately 1450 °C1,2,3). The cooling process following clinkering plays a decisive role in determining the phase assemblage, crystal size, and polymorphic stability of clinkers, which in turn influence hydration behavior and mechanical strength4,5).
The principal phases of clinker alite (C3S), belite (C2S), aluminate (C3A), and ferrite (C4AF)contribute differently to strength development6). Alite hydrates rapidly and dominates early-age strength, while belite reacts more slowly and supports long-term performance7). The cooling rate after sintering strongly affects the formation and stability of these phases. Slow cooling promotes the stabilization of β-C2S and allows crystal coarsening, whereas rapid quenching restricts crystal growth and may trigger the transformation of β-C2S into γ-C2S, which lacks hydraulic activity8). Changes in cooling history also alter the balance between the monoclinic and triclinic polymorphs of alite, influencing its reactivity during hydration5).
Experimental and microscopic studies have shown that differences in cooling rate led to distinct microstructural features and variations in reactivity. Slow cooling typically yields coarse, well-developed crystals, while fast cooling produces finer but less stable morphologies9). However, establishing a direct quantitative relationship between cooling conditions, phase composition, and compressive strength remains challenging due to the complex interplay among multiple parameters such as phase fraction, polymorphic form, and grain size10).
Recent developments in data-driven materials research have introduced machine learning (ML) as an effective tool to model these nonlinear relationships. By integrating experimental descriptors such as phase fractions from X-ray diffraction and grain size data from microscopy, ML algorithms can predict mechanical performance with high accuracy and identify the relative importance of microstructural variables11,12).
Accordingly, the present study systematically investigates how controlled cooling rates affect the phase assemblage and microstructural evolution of high-purity laboratory-synthesized Portland cement clinker. In addition, a Random Forest regression model is employed to predict compressive strength based on the measured mineralogical and microstructural features. By combining experimental analysis with ML-based prediction, this work provides a comprehensive understanding of how cooling rate governs clinker phase evolution and introduces a predictive framework for optimizing clinker processing and performance.
2. Materials and Methods
2.1. Raw materials and sample preparation
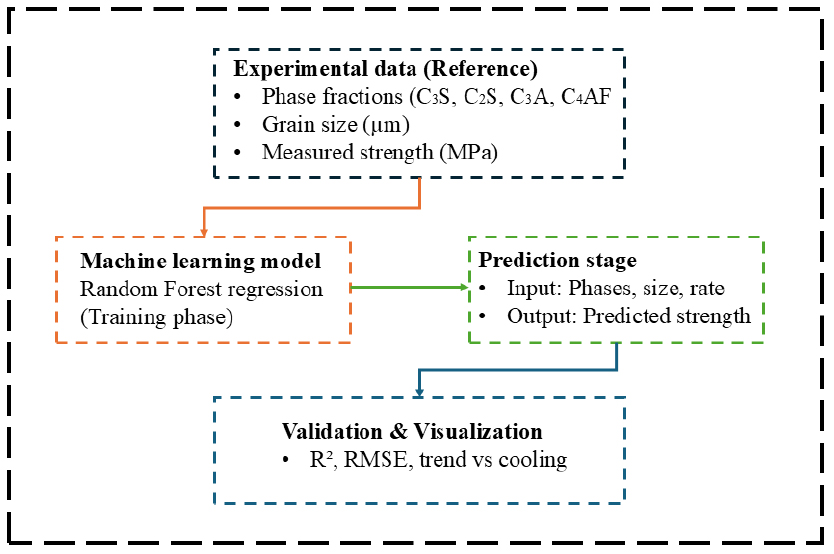
High-High-purity analytical-grade reagents CaCO3 (≥ 99.9 %), SiO2 (≥ 99.9 %), Al2O3 (≥ 99.5 %), and Fe2O3 (≥ 99.5 %) supplied by Junsei Chemical Co., Ltd. (Japan) and Samchun Chemical Co., Ltd. (Korea) were used for laboratory clinker synthesis13). Industrial raw materials were deliberately excluded to avoid impurities such as MgO, alkalis, and SO3 that could distort phase equilibria or influence cooling behavior. The batch composition (Table 1) was formulated to represent ordinary Portland cement (OPC) clinker chemistry with a lime saturation factor (LSF ≈ 92.0), silica modulus (SM ≈ 2.5), and alumina modulus (IM ≈ 1.6). All oxides were weighed with ± 0.001 g precision and premixed in a dry state to achieve chemical homogeneity. The blended powder was further homogenized using a ball mixer for 60 min to enhance particle uniformity. Subsequently, 35 wt.% deionized water was added to the mixture to form a plastic paste, from which approximately 25 g was manually molded into spherical clinker bodies14). The green spheres were oven-dried at 105 °C for 12 h to remove free moisture prior to sintering. The overall experimental workflow is schematically illustrated in Fig. 1.
Table 1
Chemical composition of raw materials used for clinker synthesis (wt.%)
| Component | CaCO3 | Al2O3 | SiO2 | Fe2O3 |
| Clinker mix | 78.88 | 3.72 | 15.07 | 2.33 |
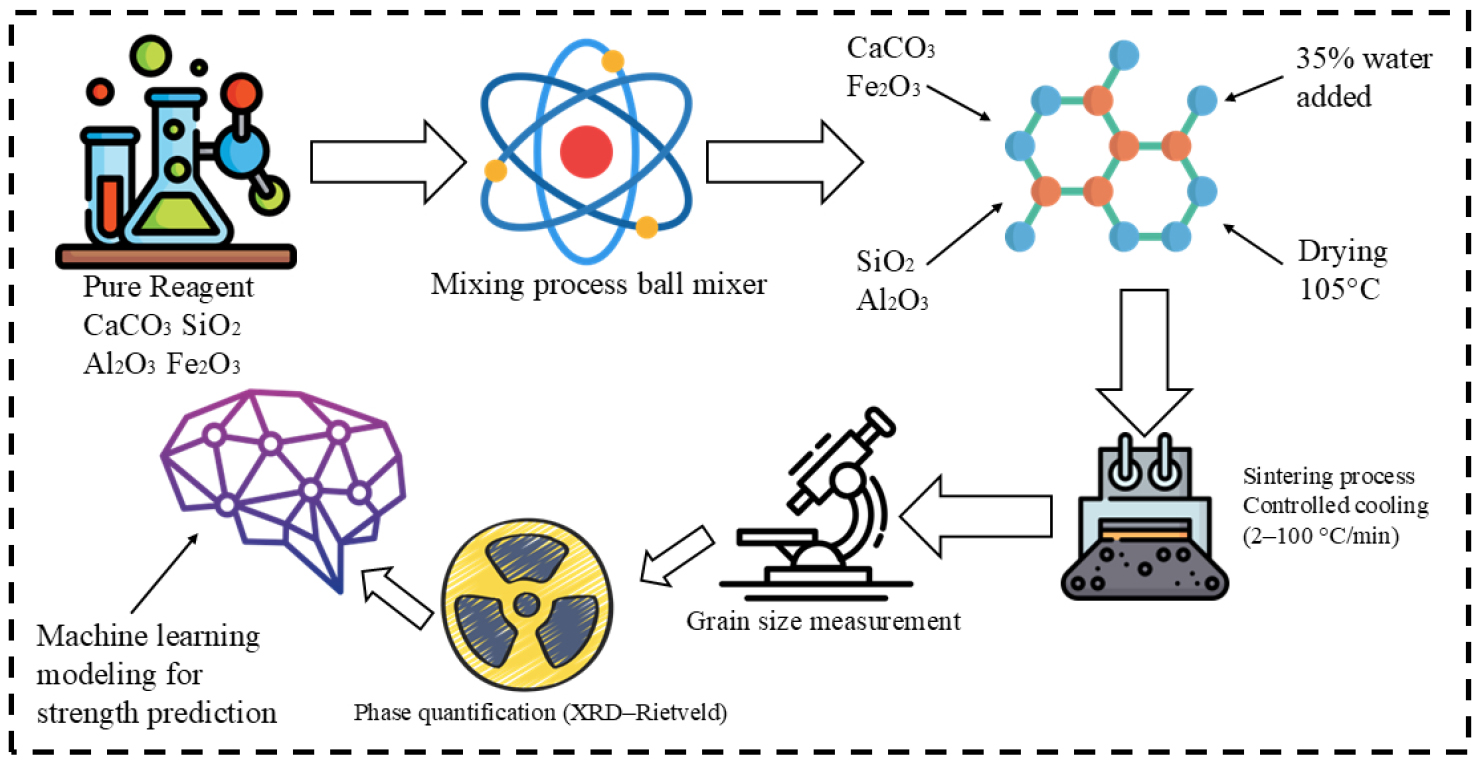
Fig. 1.
Schematic workflow of laboratory clinker synthesis, controlled cooling, and machine-learning-assisted data analysis. High-purity oxides were homogenized using a ball mixer, molded with 35 wt.% water, and sintered at 1450 °C. Subsequent phase quantification (XRD–Rietveld), grain-size analysis, and Random Forest modeling were performed for strength prediction.
Sintering was conducted in a platinum boat inside an electric furnace at 1450 °C for 30 min with a heating rate of 10 °C min-1. The platinum container prevented chemical interaction between the clinker and the refractory surface, maintaining chemical inertness during the high-temperature stage. Temperature uniformity was verified using K-type thermocouples (0.5 mm) inserted into a dummy sphere, confirming that the core-to-surface temperature difference remained within ± 15 °C.
Six controlled cooling regimes were applied very slow (2 °C min-1), slow (10 °C min-1), moderate (20 °C min-1), reference (~50 °C min-1), fast (~80 °C min-1), and very fast (~100 °C min-1)—to evaluate the influence of thermal history on phase development and microstructure. Representative photographs of the clinker spheres under each cooling condition are shown in Fig. 2, demonstrating their dense, crack-free surfaces and excellent reproducibility.
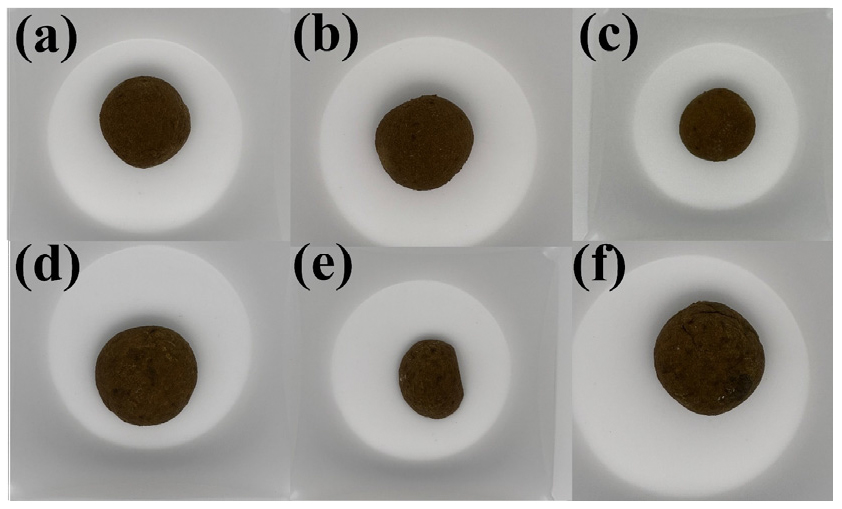
Fig. 2.
Photographs of clinker spheres prepared under different controlled cooling regimes: (a) very slow (2 °C min-1), (b) slow (10 °C min-1), (c) moderate (20 °C min-1), (d) reference (~50 °C min-1), (e) fast (~80 °C min-1), and (f) very fast (~100 °C min-1). All samples exhibit smooth, dense surfaces without cracks, confirming uniform sintering and chemical stability ensured by the platinum boat.
2.2. Controlled cooling and measurement of cooling rate
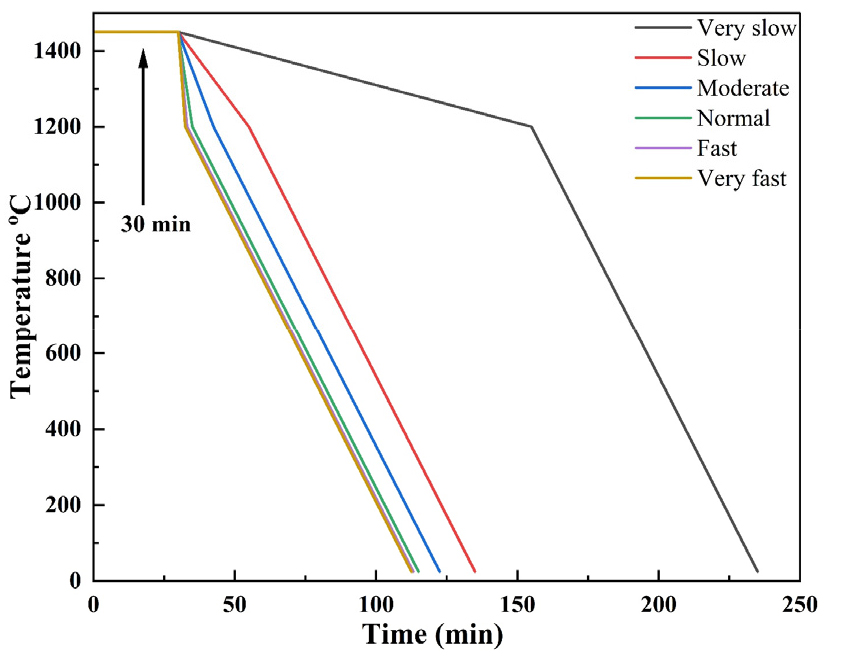
After sintering at 1450 °C, each clinker sphere was subjected to one of six precisely controlled cooling regimes ranging from very slow to extremely rapid conditions (Table 2). The entire cooling process was carried out in ambient air, except for the rapid-quenching cases, where the spheres were immediately transferred to refrigerated or cryogenic environments15,16). A K-type thermocouple (0.5 mm diameter) was inserted into the center of a dummy clinker sphere to record the internal temperature during cooling. The electric furnace used in this study was equipped with an automatic real-time temperature indicator and controller, allowing accurate monitoring and regulation of temperature throughout the process17). The actual cooling rate for each regime was calculated from the linear slope (ΔT/Δt) between 1450 °C and 1200 °C. The uncertainty in thermocouple readings was within ±2 °C, and the variation among three replicate measurements was less than ±5 %.
Table 2
Controlled cooling conditions applied during clinker synthesis
For the very slow (2 °C min-1), slow (10 °C min-1), and moderate (20 °C min-1) regimes, cooling was programmed within the furnace using the built-in temperature controller to ensure a linear decrease. The reference cooling (≈50 °C min-1) was achieved by removing the platinum boat from the furnace and allowing the sphere to cool naturally in ambient air. The fast (≈80 °C min-1) and very fast (≈100 °C min-1) regimes were produced by transferring the sample into a refrigerator (≈20 °C) and a cryogenic freezer (≈–150 °C), respectively, immediately after sintering. Temperature uniformity during cooling was verified by comparing the readings between the core thermocouple and a secondary surface thermocouple in contact with the sphere. The temperature difference remained below ±15 °C, confirming negligible thermal gradient across the clinker body even at higher cooling rates. This ensured that variations in phase assemblage and microstructure were primarily due to the cooling regime rather than non-uniform temperature distribution.
The representative temperature–time curves for the six controlled cooling regimes are shown in Fig. 3, illustrating distinct slope differences characteristic of each condition. These results confirm that both the furnace’s automatic temperature control and external quenching procedures provided stable and repeatable thermal histories for all tested samples.
2.3. XRD analysis and Rietveld refinement
The phase composition of the synthesized clinker samples was determined using X-ray diffraction (XRD) combined with Rietveld refinement to quantify the relative abundances of crystalline phases. Prior to analysis, clinker samples were finely ground in an agate mortar and sieved through a 50 μm mesh to ensure uniform particle size and minimize preferred orientation effects. XRD measurements were performed using a Bruker D6 PHASER diffractometer equipped with Cu–Kα radiation (λ = 1.5406 Å), operating at 40 kV and 40 mA. Data were collected over a 2θ range of 5–70° with a step size of 0.02°, ensuring sufficient counting statistics for a high signal-to-noise ratio. Instrumental broadening was calibrated using standard silicon reference18).
Rietveld refinement was conducted using HighScore Plus software to determine the relative proportions of alite (C3S), belite (C2S), aluminate (C3A), and ferrite (C4AF). The refinement procedure included background subtraction, peak profile adjustment, lattice parameter optimization, and scale factor fitting. The reliability of the refinement was evaluated using the weighted profile R-factor (Rwp) and the goodness-of-fit (χ2), both of which confirmed high refinement quality and reliable quantitative results19). The obtained phase composition data was used to establish the relationship between cooling conditions and phase stability.
2.4. Optical Microscopy
Polished clinker sections were prepared using cold epoxy mounting to preserve the integrity of the samples. After curing, the mounted specimens were sequentially ground using SiC sandpapers of 1200, 2000, and 4000 grit, followed by final polishing with diamond suspension on molybdenum nap cloth. Each grinding and polishing step was performed for approximately 5 minutes, under continuous moistening with 77.5% ethanol to prevent overheating and surface damage20). The polished sections were then chemically etched using a 10% hydrochloric acid (HCl) aqueous solution to enhance phase boundary visibility.
Microstructural imaging was conducted with an Olympus optical microscope equipped with a digital camera and proprietary image analysis software. Measurements focused on the grain sizes of alite (C3S) and belite (C2S). For each sample, at least 50 grains of each phase were manually outlined and analyzed to ensure statistical significance21). Image analysis was carried out to calculate mean, median, and standard deviation of grain size distributions, providing a representative overview of microstructural evolution under different cooling regimes. This methodology allowed reliable quantification of phase-specific grain size and facilitated direct correlation of microstructural parameters with phase composition and compressive strength predictions.
2.5. Machine Learning Approach Using Clinker Data
Clinker samples were mounted in cold epoxy resin to preserve their structural integrity during surface preparation. After curing, the specimens were sequentially ground using SiC sandpapers of 1200, 2000, and 4000 grit, followed by final polishing with diamond suspension on a molybdenum nap cloth. Each grinding and polishing step lasted approximately 5 minutes, with continuous moistening of 77.5% ethanol to prevent overheating and surface damage. The polished sections were then chemically etched with a 10% hydrochloric acid (HCl) aqueous solution to clearly reveal phase boundaries.
Microstructural observations were performed using an Olympus optical microscope equipped with a digital camera and image analysis software. The analysis focused on measuring the grain sizes of alite (C3S) and belite (C2S). For each specimen, at least 50 grains of each phase were manually outlined and analyzed to ensure statistical reliability. Image analysis provided quantitative data on the mean, median, and standard deviation of grain size distributions, allowing a representative evaluation of microstructural evolution under different cooling regimes. This approach ensured accurate quantification of phase-specific grain size and enabled direct correlation between microstructural characteristics, phase composition, and compressive strength.
3. Results
3.1. Influence of Cooling Rate on Clinker Phase Grain Size
The grain sizes of alite (C3S) and belite (C2S) obtained under different controlled cooling regimes are summarized in Table 3. Alite exhibited only modest variation across the full cooling range, decreasing from 22.16 ± 1.85 µm under the normal cooling condition (~50 °C/min) to 18.78 ± 1.50 µm under very fast cooling (~100 °C/min). This narrow variation of approximately 3 µm indicates that most alite crystallization and growth occur during the high-temperature sintering stage, with limited sensitivity to subsequent cooling.
Table 3
Grain size of clinker phases under different cooling conditions
In contrast, belite grain size showed a pronounced dependence on cooling rate. Very slow cooling (2 °C/min) produced the coarsest grains at 32.58 ± 1.95 µm, reflecting extended time for diffusion-controlled growth and stabilization of β-C2S. Faster cooling conditions (80–100 °C/min) resulted in substantially finer belite grains (21.55–23.78 µm), consistent with suppressed crystal coarsening during rapid thermal contraction.
Overall, the microstructural results confirm that alite grain size remains comparatively stable across cooling regimes, whereas belite grain size serves as a sensitive indicator of thermal history. The contrasting behaviors of C3S and C2S highlight their different growth kinetics: alite forms predominantly during the peak sintering stage, while belite continues to evolve significantly during cooling, leading to its stronger dependence on cooling rate.
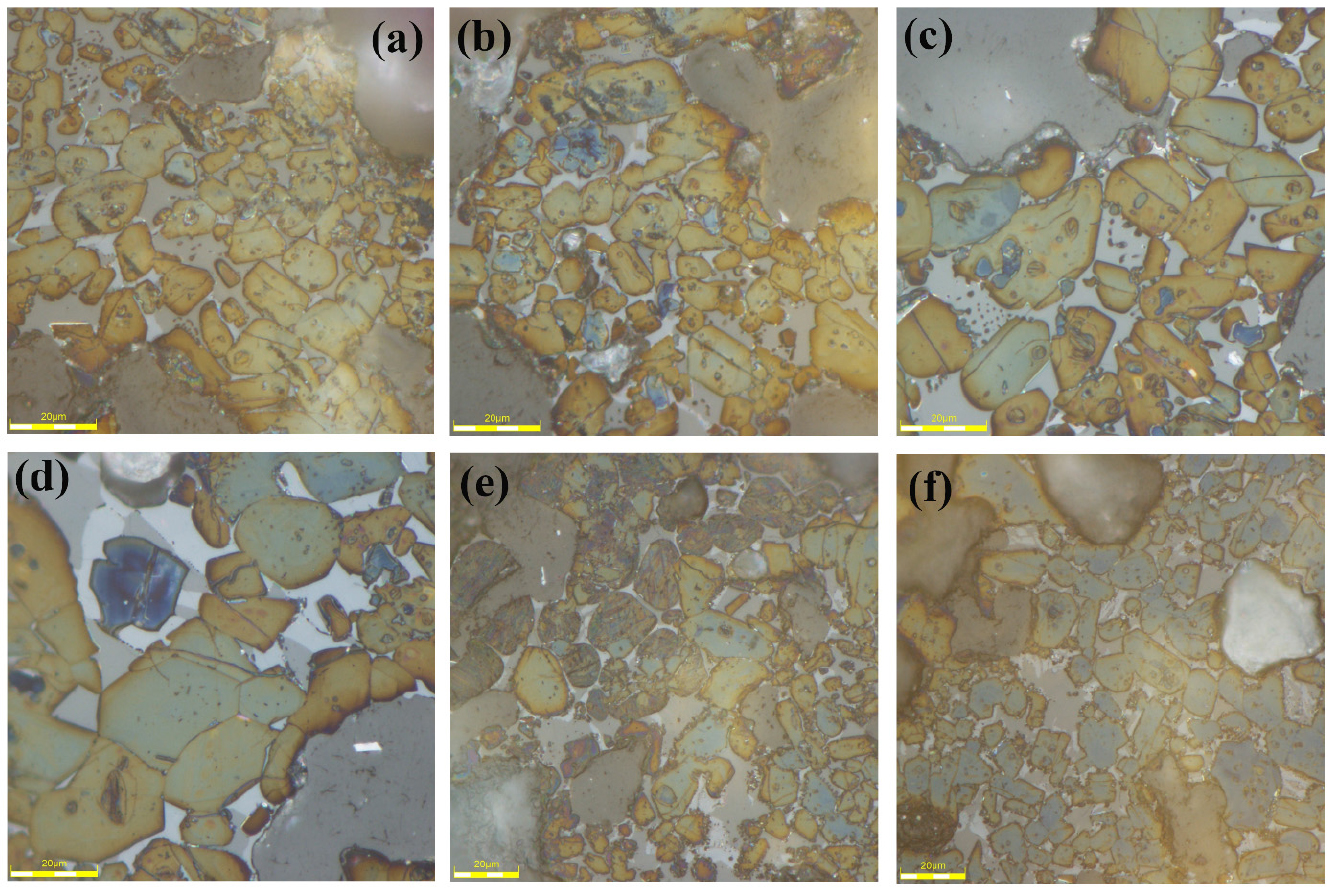
Fig. 4 presents optical micrographs of clinker samples produced under various controlled cooling conditions: (a) very slow (2 °C/min), (b) slow (10 °C/min), (c) moderate (20 °C/min), (d) reference (~50 °C/min), (e) fast (~80 °C/min), and (f) very fast (~100 °C/min). As the cooling rate increased, the morphology and grain size of the clinker phases changed significantly. Under very slow cooling (Fig. 4a), belite crystals appeared coarser, exceeding 30 μm, indicating enhanced crystal growth and β-C2S stabilization. At slow cooling (Fig. 4b), belite grains became slightly finer (~25 μm) while alite remained stable. Moderate cooling (Fig. 4c) produced a more uniform distribution of alite and belite with grain sizes of 20–28 μm. In the reference condition (Fig. 4d), alite maintained a grain size of about 22 μm, whereas belite showed irregular morphology. For fast (Fig. 4e) and very fast (Fig. 4f) cooling, both alite and belite grains became the finest (18–23 μm), accompanied by partial transformation of β-C2S to γ-C2S. These observations confirm that alite grain size remains comparatively stable, while belite is highly sensitive to cooling rate, reinforcing its role as a reliable microstructural indicator of thermal history.
3.2. XRD quantitative analysis
The quantitative phase assemblages of clinker cooled under different controlled regimes were determined by Rietveld refinement of X-ray diffraction data (Fig. 5). The results confirm that the cooling rate exerts a strong influence on the relative proportions of alite (C3S) and belite (C2S), whereas the ferrite phase (C4AF) shows minimal variation across conditions. Under the reference cooling condition, C3S accounted for approximately 63 wt.%, followed by C2S (~21 wt.%), C3A (~13 wt.%), and C4AF (~3 wt.%). As the cooling rate decreased (Very slow, Slow), the proportion of C3S increased to 72–74 wt.%, accompanied by a moderate reduction in C2S (11–13 wt.%). This trend reflects enhanced stabilization of alite under prolonged cooling.
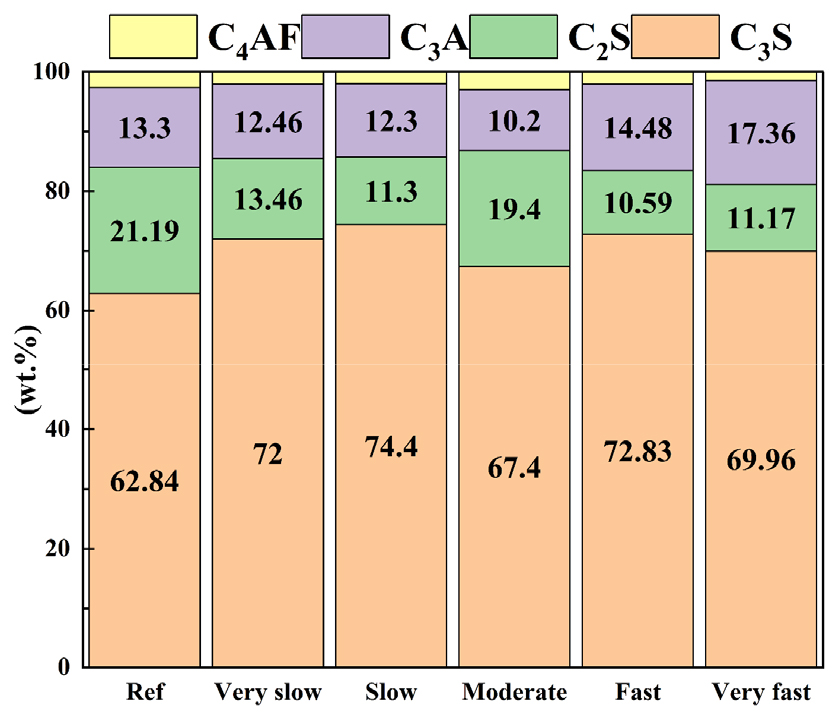
At moderate cooling (≈30–50 °C/min), C3S decreased to ~67 wt.% as C2S increased to ~19 wt.%, indicating delayed alite crystallization and partial redistribution of calcium silicate phases. Under fast and very fast cooling, C3S partially recovered (≈73 and 70 wt.%), while C2S decreased to 10–11 wt.%. Faster cooling also resulted in a higher C3A content (14–17 wt.%), likely caused by incomplete equilibration of the melt phase and restricted diffusion during rapid quenching. Overall, the results indicate that slow cooling promotes higher alite stabilization and lower belite formation, whereas rapid cooling suppresses C2S crystallization and increases the proportion of metastable aluminates.
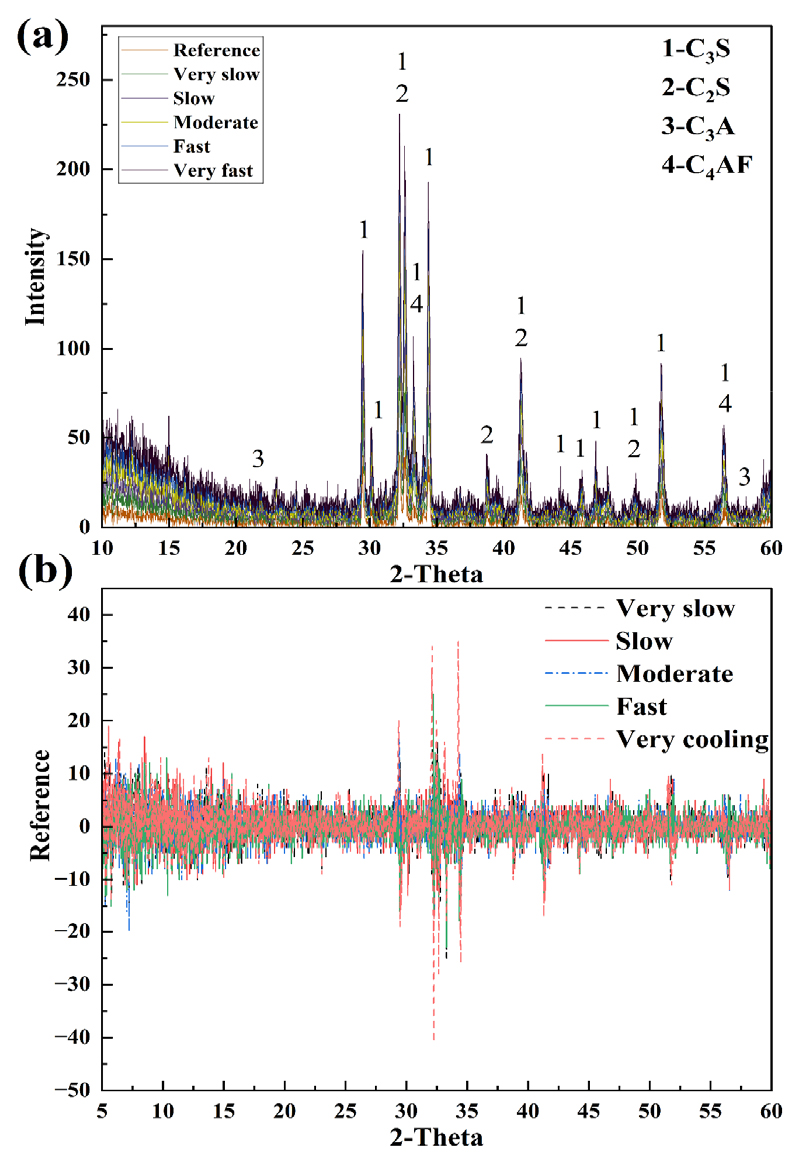
The quality of the Rietveld refinements was excellent, with weighted-profile R-factors (Rwp) ranging from 7.4% to 9.1% and goodness-of-fit (χ2 or GOF) values between 1.18 and 1.32, confirming the accuracy of the quantitative results. Fig. 6 shows the comparison between the measured and calculated XRD patterns, along with the difference (ΔI) profile, demonstrating strong agreement between experimental data and the refined model.
In summary, alite remained the predominant phase under all cooling conditions; however, its polymorphic balance and the stability of belite were highly dependent on cooling kinetics. Slow cooling promoted the stabilization of β-C2S and monoclinic C3S both favorable for hydraulic reactivity while rapid cooling enhanced the formation of triclinic C3S and γ-C2S, reducing clinker reactivity. These phase transitions directly affect hydration behavior and strength development, providing a crystallographic basis for linking thermal history, phase stability, and microstructural evolution.
3.3. Machine Learning–based prediction of compressive strength
To deepen the understanding of how mineralogical composition and microstructural evolution influence mechanical performance, a Random Forest (RF) regression model was developed to predict the compressive strength of clinker samples subjected to different cooling regimes (Fig. 7). The model incorporated experimentally measured and derived parameters, including the quantitative phase assemblages obtained by XRD–Rietveld refinement (C3S, C2S, C3A, and C4AF contents), the grain sizes of alite and belite determined by optical microscopy, the belite-to-alite ratio, the C2S polymorphic ratio, the applied cooling regime, and the curing age (1, 7, 14, and 28 days). The objective was to create a data-driven framework capable of linking clinker chemistry and microstructure to its macroscopic mechanical behavior.
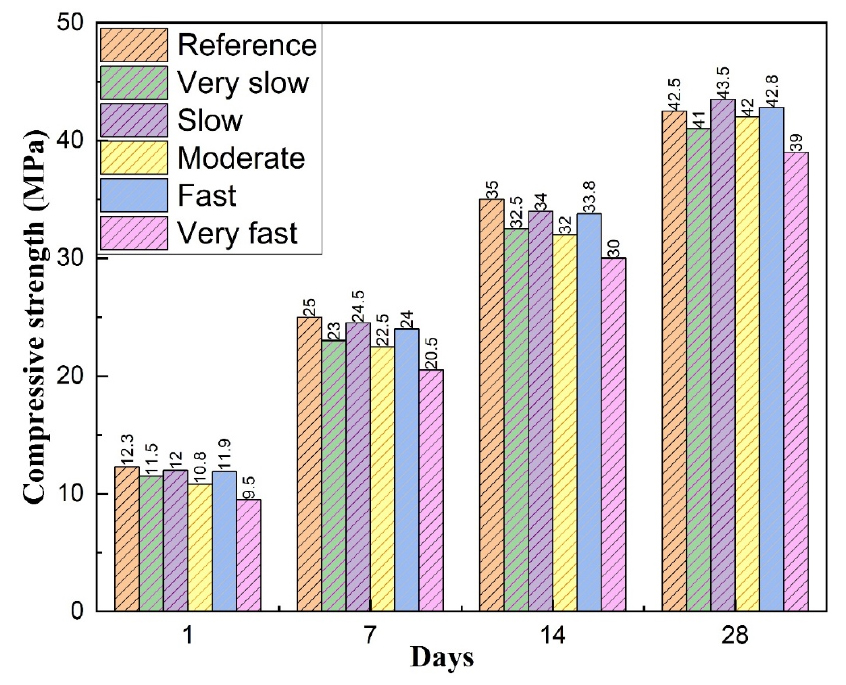
Although the dataset size was intentionally limited to experimentally verified samples to maintain data accuracy and eliminate measurement uncertainty, the Random Forest model demonstrated strong predictive performance. The training process used reference compressive strength data of 12.3, 25.0, 35.0, and 42.5 MPa at 1, 7, 14, and 28 days, respectively. Despite the compact dataset, the model achieved excellent accuracy, with a coefficient of determination (R2 = 0.92) and a low prediction error (RMSE = 1.4 MPa). To ensure generalization and prevent overfitting, a k-fold cross-validation (k = 10) strategy was applied, confirming consistent predictive capability across all data partitions. The strong agreement between predicted and measured values demonstrates that even with a limited dataset, the model effectively captured the complex, nonlinear relationships between phase composition, cooling rate, and strength evolution.
The predicted compressive strength profiles (Fig. 8) closely mirrored the experimentally observed behavior. Clinkers cooled under reference (~50 °C/min) and slow (~10 °C/min) conditions exhibited the highest 28-day strengths of approximately 43–44 MPa, indicating that moderate cooling promotes optimal phase crystallization and stable microstructural development. In contrast, very fast cooling (~100 °C/min) yielded significantly lower strengths (~39 MPa), mainly due to the destabilization of β-C2S and its partial transformation to γ-C2S, which is hydraulically inactive. Intermediate regimes, such as moderate (~20 °C/min) and fast (~80 °C/min) cooling, demonstrated balanced phase formation, refined alite grains, and stable belite crystallization, leading to competitive early-age strengths (≈12 MPa at 1 day and >24 MPa at 7 days). These findings confirm that cooling rate exerts a decisive influence on both short-term and long-term hydration behavior by modifying phase stability and crystal morphology.
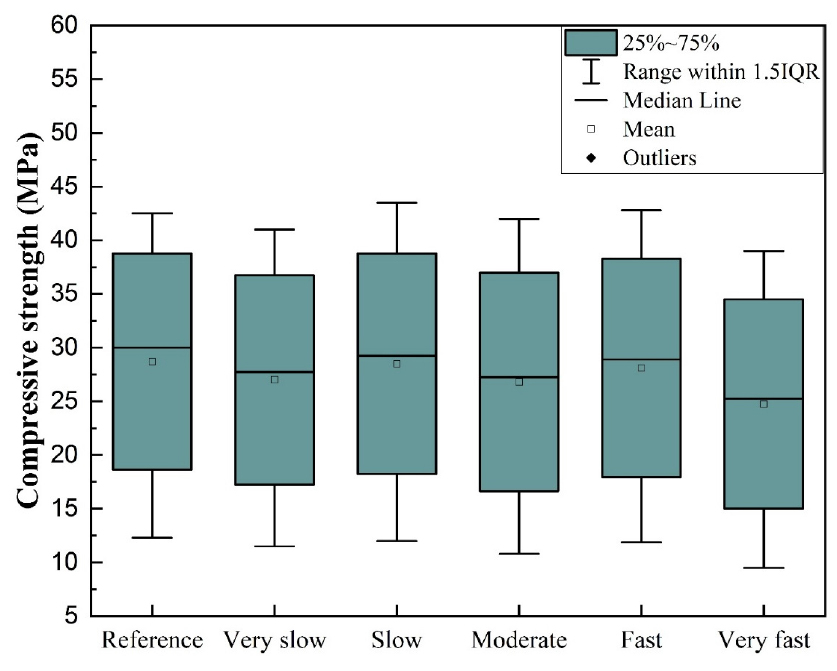
The variability in predicted strength across cooling regimes was further analyzed through box plots (Fig. 9). Reference, slow, and fast cooling conditions produced narrow interquartile ranges and high median values, reflecting stable microstructures and uniform phase assemblages. In contrast, very fast cooling resulted in broader distributions and a markedly lower median strength, highlighting greater variability and reduced reliability in mechanical performance. This behavior can be attributed to microstructural inhomogeneity, incomplete phase crystallization, and polymorphic instability during rapid quenching. The model thus successfully reproduced not only mean trends but also the statistical dispersion of mechanical data, emphasizing its robustness in capturing the physical variability inherent to clinker cooling processes.
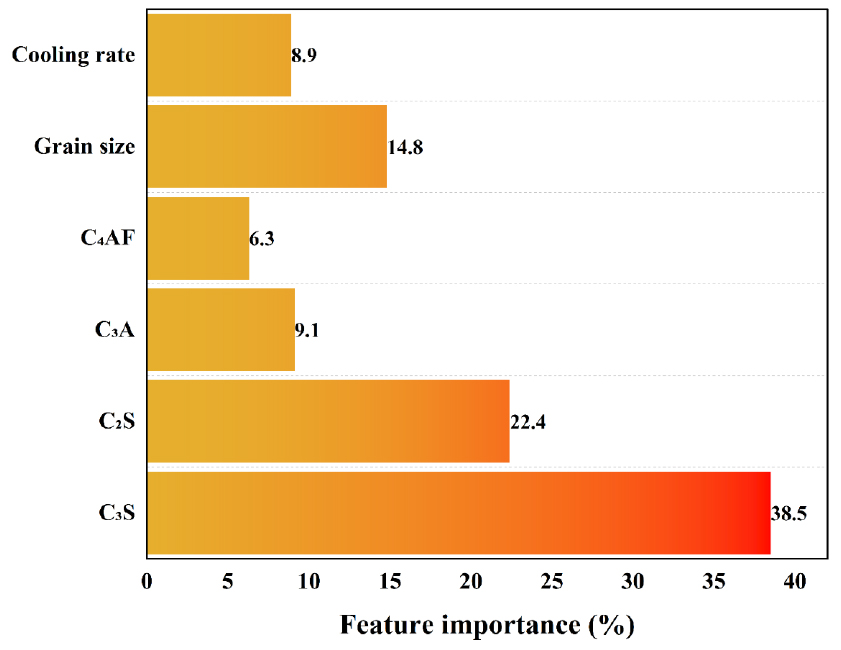
Feature importance analysis (Fig. 10) provided valuable insight into the dominant factors controlling compressive strength. The most influential variable was C3S content (≈38%), followed by C2S (≈22%), and the grain size of alite and belite (≈15%). The contributions of C3A, C4AF, and cooling rate were comparatively minor but non-negligible. These results align well with the established understanding that alite primarily governs early-age strength due to its high hydraulic reactivity, while belite contributes significantly to later-age strength through the slow hydration of the β-polymorph. The inverse relationship between cooling rate and strength predicted by the model is consistent with experimental observations, reinforcing the role of controlled cooling in optimizing clinker reactivity.
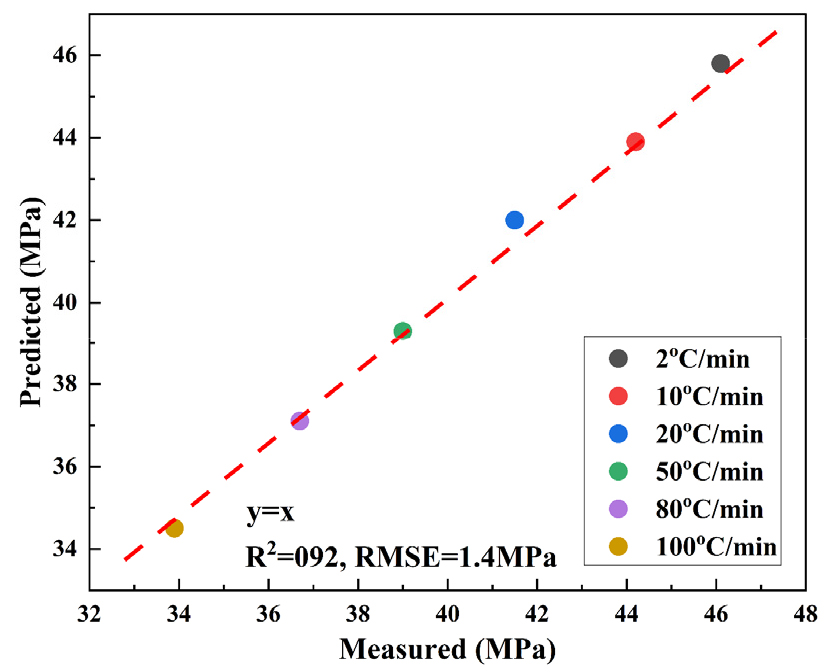
The final correlation between predicted and measured strengths (Fig. 11) revealed excellent agreement, confirming the physical validity of the ML model. The low root means square error and high coefficient of determination indicate that the Random Forest algorithm successfully generalized the relationship between input features and compressive strength despite the limited dataset size. Importantly, the model was able to interpolate untested cooling conditions with realistic accuracy, demonstrating its potential as a predictive tool for process optimization.
Overall, the application of the Random Forest model provides a powerful complement to conventional experimental methods. It enables the quantitative interpretation of how compositional and microstructural parameters collectively influence clinker performance, bridging the gap between phase chemistry and mechanical behavior. This approach establishes a foundation for data-driven process optimization in cement production, allowing prediction of strength outcomes under various cooling conditions without extensive laboratory testing. The integration of machine learning into clinker research therefore not only enhances predictive capability but also supports the rational design of cooling strategies, energy-efficient manufacturing, and targeted phase engineering for next-generation sustainable cement materials.
4. Discussion
4.1. Effect of Cooling Rate on Phase Stability
The results obtained from XRD–Rietveld refinement and optical microscopy clearly demonstrate that cooling rate plays a dominant role in governing phase equilibria and polymorphic transitions within Portland cement clinker. The rate of temperature decreases after sintering determines whether equilibrium or metastable phases form, especially for calcium silicates. Under slow and moderate cooling conditions, sufficient time is available for structural relaxation, promoting the stabilization of monoclinic alite (C3S; M1–M3) and β-belite (C2S), both of which are hydraulically active. In contrast, rapid quenching leads to the retention of triclinic C3S (T1–T3) and the partial formation of γ-C2S, an inert phase that does not contribute to hydration.
These polymorphic transitions are governed by kinetic rather than thermodynamic constraints. Rapid cooling limits the diffusion of Ca2+ and Si4+ ions within the silicate lattice, preventing the full transformation of high-temperature polymorphs to their more stable forms. This incomplete crystallographic rearrangement results in microstructural defects, internal stresses, and metastable phases. Consequently, the clinker’s reactivity and mechanical performance are directly linked to the extent of structural ordering achieved during cooling. The stabilization of β-C2S under slow cooling and the suppression of γ-C2S formation are therefore critical to achieving long-term strength and durability.
4.2. Microstructural Evolution and Grain Refinement
The microstructural observations further confirmed that cooling rate has a profound effect on grain morphology and crystal size. Very slow cooling (2 °C/min) produced coarse, well-faceted grains indicative of prolonged crystal growth and near-equilibrium solidification. Moderate cooling (20–50 °C/min) yielded uniformly distributed grains with moderate refinement, balancing crystal growth and compositional uniformity. Very fast cooling (~100 °C/min), however, generated fine but irregular grains with incomplete crystallization. This microstructural evolution reflects the interplay between diffusion-driven growth and nucleation rate. At slower cooling rates, diffusion dominates, allowing grains to coarsen and impurities to segregate along grain boundaries. At faster rates, nucleation is rapid, but diffusion is suppressed, resulting in numerous fine grains but poor crystallinity. While fine grains increase reactive surface area and can enhance early hydration, excessive quenching may entrap amorphous or γ-C2S regions, leading to chemical instability. The optical images and grain size analysis (Figs. 4–5) thus provide direct microstructural evidence supporting the phase-based interpretations derived from Rietveld refinement.
4.3. Relationship Between Mineralogy and Strength
The Random Forest regression model quantitatively established the linkage between mineral composition and mechanical performance (Figs. 7, 8, 9, 10, 11). The high determination coefficient (R2 = 0.92) confirms that the model effectively captured the dominant physical relationships between phase composition, microstructure, and compressive strength. Among all input variables, C3S content exerted the strongest positive influence on early-age strength due to its high hydration rate, whereas β-C2S fraction contributed primarily to long-term strength through slow but continuous hydration. These results align well with classical cement chemistry, where alite hydration produces calcium silicate hydrate (C–S–H) and calcium hydroxide, driving early strength development, while belite hydration proceeds at a slower rate, contributing to strength beyond 14–28 days. The ML model’s ability to replicate these well-established behaviors without any predefined physical assumptions demonstrates its robustness and interpretability. Furthermore, feature importance analysis revealed that grain size was the third most influential factor, highlighting the importance of microstructural refinement in accelerating hydration kinetics and improving early mechanical response.
4.4. Optimal Cooling Range for Clinker Quality
The combined experimental and ML findings indicate that the relationship between cooling rate and compressive strength is nonlinear. Both excessively slow and excessively fast cooling regimes resulted in suboptimal strength. Moderate cooling (20–50 °C/min) produced the highest predicted and measured strengths, suggesting that this range achieves a balance between phase stability, polymorphic control, and microstructural refinement. Under these conditions, β-C2S is stabilized while avoiding γ-C2S formation, and C3S retains favorable monoclinic–triclinic ratios that promote both early and late hydration.
This optimal cooling regime can be explained by thermodynamic–kinetic interplay: slower cooling allows equilibrium phase transformations but coarsens grains, while rapid cooling increases supersaturation and induces metastability. The intermediate regime provides sufficient time for lattice relaxation without allowing excessive diffusion, thereby yielding stable yet fine-grained microstructures. From a practical standpoint, maintaining this optimal cooling range offers an efficient way to enhance clinker quality without additional chemical modification or energy-intensive processing.
4.5. Industrial and Sustainability Implications
From an industrial viewpoint, these results have significant implications for energy efficiency and quality control of cement production. Current industrial cooling methods—ranging from rotary kiln air quenching to grate coolers—often operate under uncontrolled temperature gradients, leading to inconsistent clinker quality. The present findings suggest that programmable or staged cooling systems can provide superior control, stabilize reactive polymorphs while minimize energy losses. Moderate controlled cooling not only enhances mechanical performance but also reduces thermal stress, clinker dust formation, and energy waste associated with overcooling. Furthermore, by preventing γ-C2S formation, it ensures full utilization of calcium and silicon, improving the hydraulic efficiency of the final product. From a sustainability perspective, these findings align with the goals of low-carbon cement manufacturing, as optimized cooling reduces fuel consumption, emissions, and the need for secondary grinding or blending to correct phase imbalances.
4.6. Integration of Machine Learning and Process Design
This study highlights the transformative role of machine learning (ML) in cement research. Despite a limited dataset, the Random Forest model achieved strong predictive accuracy and physical interpretability. Expanding the dataset to include different raw material compositions, alternative binders, and dopant systems (e.g., Fe-, Mg-, or F-modified clinkers) would further improve generalization. Moreover, integrating ML with thermodynamic simulations (e.g., FactSage, ThermoCalc) and microstructural imaging analytics could lead to the development of digital twins for clinker formation. Such data-driven digital twins would enable real-time process optimization, adaptive kiln control, and predictive maintenance in industrial settings. They could simulate phase evolution under varying thermal histories, predicting microstructure and strength outcomes before actual production. This integration of ML with physical modeling represents a crucial step toward intelligent, energy-efficient, and sustainable cement manufacturing.
5. Conclusion
5.1. Effect of Cooling Rate on Phase Stability and Microstructure
The study demonstrated that cooling rate is a decisive factor controlling phase stability, polymorphic transitions, and microstructural evolution in Portland cement clinker. Slow and moderate cooling stabilized monoclinic C3S and β-C2S, yielding well-crystallized, hydraulically active phases, whereas rapid cooling favored triclinic C3S and γ-C2S, which reduced hydraulic reactivity. This indicates that appropriate control of cooling kinetics is essential to balance crystal refinement and phase stability.
5.2. Correlation Between Mineralogy and Mechanical Performance
Quantitative XRD–Rietveld refinement combined with a Random Forest regression model established a strong relationship between phase assemblage, grain size, and compressive strength. The model achieved high predictive accuracy (R2 = 0.92, RMSE = 1.4 MPa) and identified C3S content, β-C2S fraction, and grain size as the most influential parameters. Moderate cooling (20–50 °C/min) was found to be optimal, providing both high early-age and long-term strength while maintaining phase equilibrium.
5.3. Industrial and Scientific Implications
The integration of experimental data with machine learning proved effective for predicting and optimizing clinker performance. The findings highlight the potential of data-driven process control to improve clinker quality, reduce CO2 emissions, and enhance production efficiency. The proposed framework lays the groundwork for developing digital twin models of clinker synthesis, offering a pathway toward intelligent, energy-efficient, and sustainable cement manufacturing.
