

1. Introduction
2. Model description
3. Experiments
3.1. Measurement of descending velocity with and without stirring
3.2. Measurement of velocity of silicon oil by PIV (particle image velocimetry)
4. Result and Discussion
4.1. Influence of viscosity on descending velocity of droplets without stirring
4.2. Flow of silicone oil by PIV
4.3. Measurement and model predictions of descending velocity of droplets with stirring
5. Conclusion
1. Introduction
The admixture of two immiscible liquids is necessary for improving the efficiency of various reactions and refining in fields such as biodiesel1), Cu smelting2), and polymerization reactors3). In the steelmaking process, the efficiency of the metal-slag reaction can be improved by increasing the interfacial area between the metal and slag phases. The interfacial area can be increased by generating many tiny metal droplets in the slag phase, to produce a system termed a “metal emulsion”4,5,6,7). It is well known that the decarburization rate of metal droplets emulsified in the slag phase is very rapid8,9) and the dephosphorization of metal droplets is enhanced by internal stirring caused by CO gas generation10).
The influence of the physical properties and bubbling conditions on the generation of metal emulsions has been investigated by many researchers using cold models (water/oil4,5), Hg/water, etc.6,7)) or systems comprising low-melting-point metals and molten salts6,7,11,12,13,14,15,16). The interfacial area between slag and metal largely increases, increasing the rate of decarburization and dephosphorization. The metal droplets are generated by bottom blowing during the steelmaking process and ascended very rapidly into the molten slag phases. During bottom blowing, the rising bubbles enter the slag phase covered by a thin film of liquid steel. This membrane separates forming tiny liquid metal droplets. These droplets are fully surrounded by the slag phase. The interfacial area between slag and metal largely increased. The droplets can undergo decarburization and dephosphorization at the interface with the slag phase. A larger reaction interface can improve the rate of reaction between molten steel and slag15). However, fine droplets that are too small cannot descend into the molten steel, but remain in the slag for a long time and cause a decrease in the metallic yield17). Thus, the droplet size can be manipulated to control its descending velocity, as one solution for reducing metal loss and improving the process efficiency.
In two previous papers18,19), a theoretical model of the ascending and descending velocity of metal droplets such as Sn, Pb, and Al by applying the momentum balance equation using buoyancy force, gravitational force, drag force, and added mass force was proposed. In a single-composition molten salt at 723 K, the rising velocities of the bubbles and the descending velocities of the metal droplets were measured for bubbles and droplets of various sizes. The terminal velocity of the descending droplets increased with the droplet size. The predicted descending velocity was in good agreement with the observed descending velocity of the metal droplets in the molten salt. Although, by the proposed model, the influence of the slag viscosity on the descending velocity of iron droplets was predicted, but it could be changed in the experimental work. Furthermore, in the model, the measured velocity of the descending droplets is the relative velocity, which includes the true velocities of the metal droplets with respect to molten steel. In consequence, it was assumed that the initial relative velocity of the droplet was the same as the relative velocity at the starting point of the ascending and descending processes because of the lack of information on the velocity of the molten salt.
In the present study, to investigate the influence of the viscosity of the liquid phase on the descending velocity of the droplet, a cold model using silicone oil with different viscosities was carried out by water droplets at room temperature, as a substitute for the metal-in-slag emulsion. Using the particle image velocimetry (PIV) method, the velocity of silicon oil is measured, after which the velocities of water droplets of various sizes are measured and simulated by applying the momentum balance equation using the velocity of silicon oil. With this information, it is now possible to obtain a better understanding on the effect of oil viscosity on oil/water emulsions containing water droplets of different sizes.
2. Model description
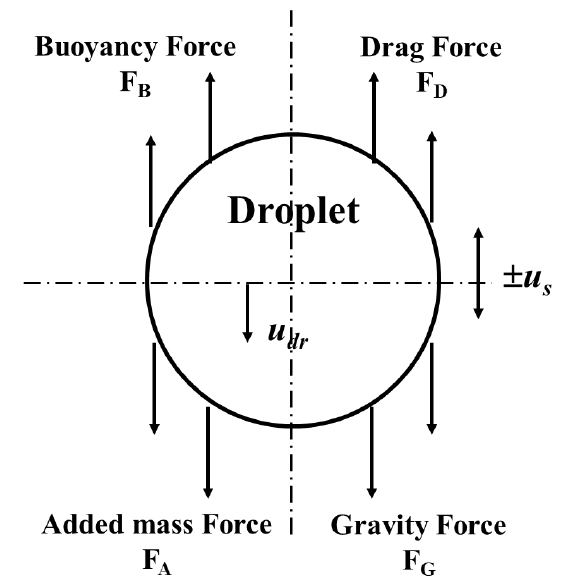
In fluids, the forces acting on droplets are gravity, buoyancy, drag, and additional mass forces. Fig. 1 shows a schematic of the direction of the various forces acting on the descending droplet. The details of the calculation for the descending and ascending velocities of the droplets are described in previous papers18,19). In this study, the balance of forces for the descending droplets is briefly described. In general, buoyancy and gravity exert upward and downward forces, respectively, on the droplet. The direction of the added mass force is the same as that of the descending droplets and is opposite to that of the drag force. The forces acting on the droplet can be expressed by Eqs. (1),(2),(3),(4):
where udr is the relative velocity of the descending droplet (m/s), ρd and ρs are the densities of phase 2 (silicon oil, kg/m3) and phase 1 (water, kg/m3), respectively; rd is the diameter of the droplet in phase 1 (m), and g is the acceleration due to gravity (m/s2). CD is the drag coefficient18,19), which depends on the Reynolds number (NRe) and can be expressed as follows:
Based on the direction of the forces, the momentum balance can be obtained as shown in Eq. (6).
The relative velocity of the falling droplet (udr) can be obtained by substituting Eqs. (1),(2),(3),(4) into Eq. (5) and integrating the result using the boundary conditions; that is, at t = 0, udr = udr,0 as follows:
where udr,0 is the initial velocity of the droplet, and A and B are as follows:
In previous study18,19), by calculation, the descending velocity of iron droplet with 3.8 mm of diameter increased with time and then, was constant less than about 1 sec. It is well-known that the maximum velocity is fluid dynamically “terminal velocity”. In the present study, we observed and calculated terminal velocity of droplet and was presented as “descending velocity” in this paper because the time to be terminal velocity was very short within 1 sec.
3. Experiments
3.1. Measurement of descending velocity with and without stirring
To investigate the influence of oil viscosity on the descending velocity of water droplets, three types of silicone oils (silicone oil I, II, and III) were used as materials to substitute the slag using a cold model. Distilled water was used as a substitute for molten steel, where the viscosity ratio and kinematic viscosities at room temperature were similar to that in the actual process. Table 1 presents a comparison of the viscosity ratios of steel/slag and water/oil systems. It can be observed a large difference in the density ratio, about 2 for the steel/slag system and about 1.0 for the water/oil system. It is possible to obtain slightly higher density ratios for the water/oil system, but then all commercial oils give almost similar values for the viscosity of water and oil which is totally unrealistic of the real steel/slag system20). The change in oil viscosities is about one order of magnitude (from 0.0093 to 0.0096 Pa×s). Therefore, in the present study, to observe the behavior of droplets in the transparent liquid phase, the working temperature and density ratios of water/oil were varied owing to experimental limitations.
Table 1
Comparison of parameters in experiment versus actual process
Fig. 2(A, B) presents schematics of the experiment for measuring the descending velocity of the water droplets with and without stirring of silicon oil. Polycarbonate containers (150 mm in width, 150 mm in height, or 300 mm in height) were filled with silicone oil (100 mm in height), then distilled water was dropped into the silicone oil, and its trajectory observed with a camera. Droplets of distilled water represent metal droplets, and the silicone oil filled in the polycarbonate containers represent the slag phase. The diameter of the water droplets was controlled by varying the number of water droplets using a dropping pipette. The descending images were recorded using a CCD camera (Nikon J5). The recorded images were edited using a video editing program and an image measurement program (ImageJ Pro). The size of the descending droplet and the distance of the descending droplet were measured in pixel units, and the actual length was calculated using a proportional formula in pixel units. As shown in Fig. 2(B), the stirring of silicon oil was generated by a submersible pump, where the inner diameters of the inlet and outlet were 7.8 mm and 5.8 mm, respectively, and the flow rate of water was 0.00583 m3/min. The merit of a submersible pump is that it generates stirring without bubble formation.
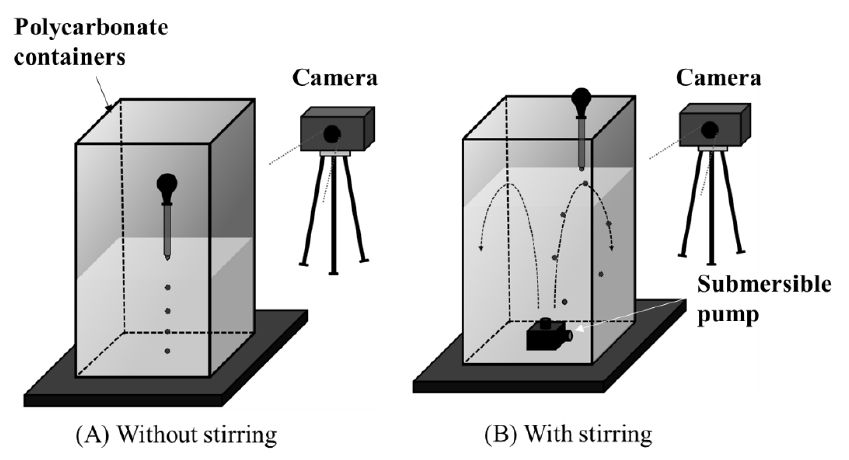
Fig. 3(A, B) shows the descending behavior of distilled-water droplets in silicone oil III with and without stirring. From Fig. 3(A), without stirring, the diameter of the distilled water droplets was measured as approximately 4.62 mm. The droplets settled (moved downwards) from the upper part with the progress of time. A descending droplet of distilled water made contact with the bottom surface within 8 s. The descending distance and time were measured using an image software and common video software, respectively. To ensure the reliability of the measured value, more than ten analyses for droplets with similar diameters were carried out. In Fig. 3(B), with stirring, the ascending and descending behaviors of the droplet are represented during two cycles, where the diameter of the droplet was approximately 7.11 mm. The ascending time for the water droplets was ~0.5 s because of the low density of water. Because the ascending time was very short, the descending time could be precisely measured in the present study. By analyzing the descending distance and time, the influence of the viscosity and droplet size on the descending velocity was investigated.
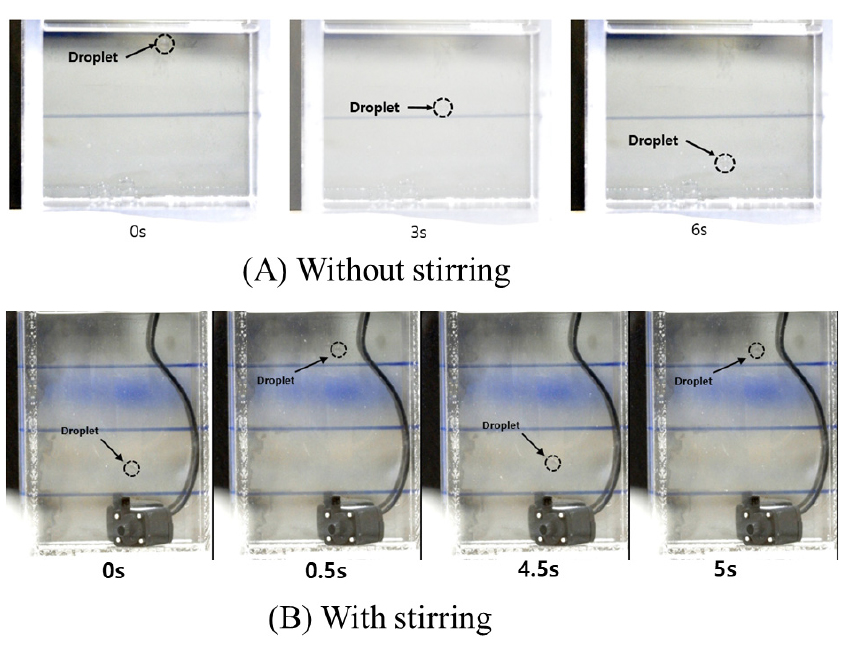
Fig. 3
Descending behaviors of water droplets in silicone oil Ⅲ with and without stirring. In Fig. 3(B), the ascending and descending behaviors of the water droplets were observed during two cycles.
3.2. Measurement of velocity of silicon oil by PIV (particle image velocimetry)
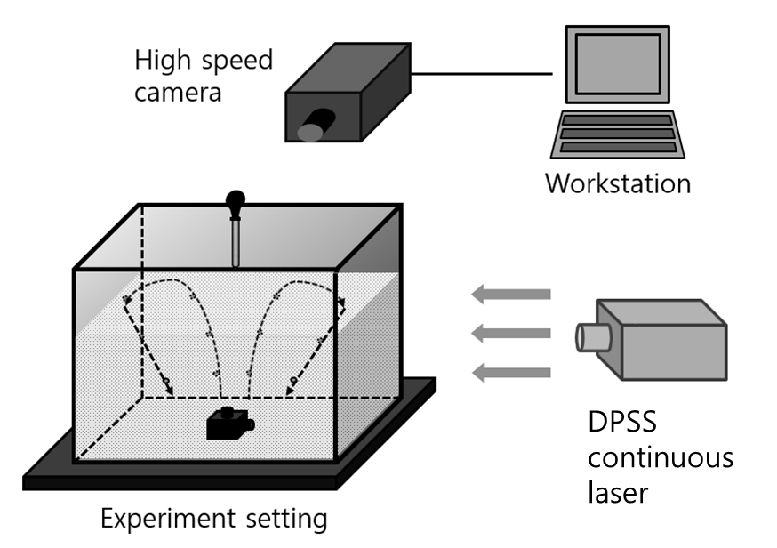
The velocity of the silicon oil was measured using PIV. Fig. 4 shows a schematic image of the PIV setup. In this experiment, traceable, fluorescent polymer particles (FPP) were added after the polycarbonate box was filled with silicon oil. Subsequently, a submersible pump was installed under the box to generate the flow. 8-W diode-pumped solid-state (DPSS) continuous laser (Changchun New Industries Optoelectronics Technology Co., China) with a wavelength of 532 nm was injected into the fluid to observe the fluid flow. Images were captured using a high-speed camera (FASTCAM Mini UX50) capable of capturing an image of 1280 × 1024 pixels at 2000 fps at a maximum frame rate of 16000 fps. The experiment was conducted in a blackout room.
4. Result and Discussion
4.1. Influence of viscosity on descending velocity of droplets without stirring
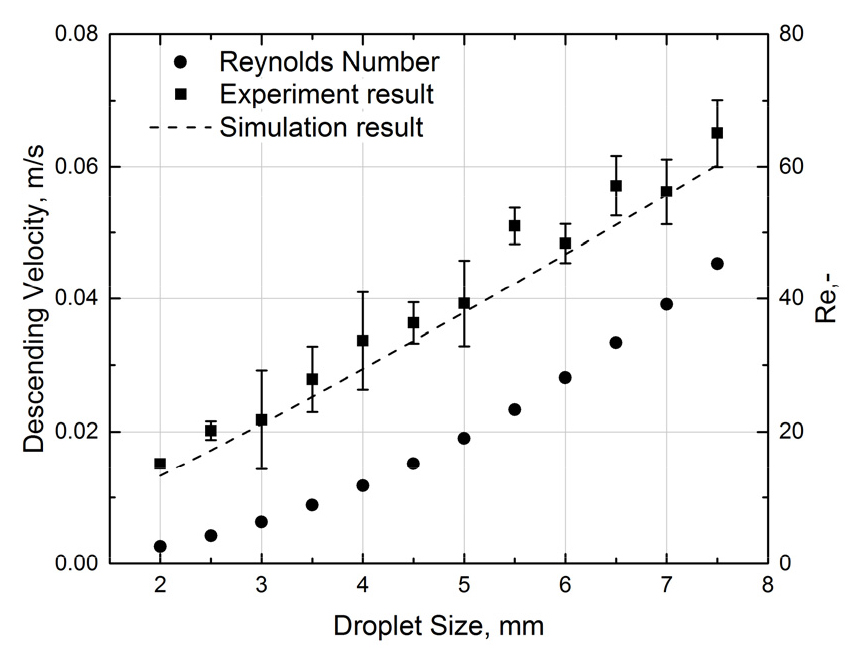
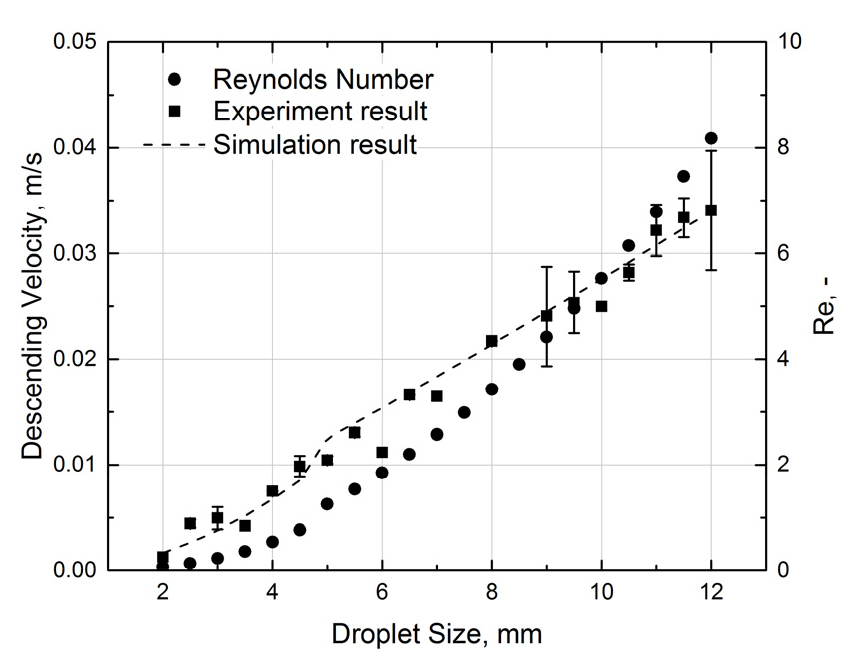
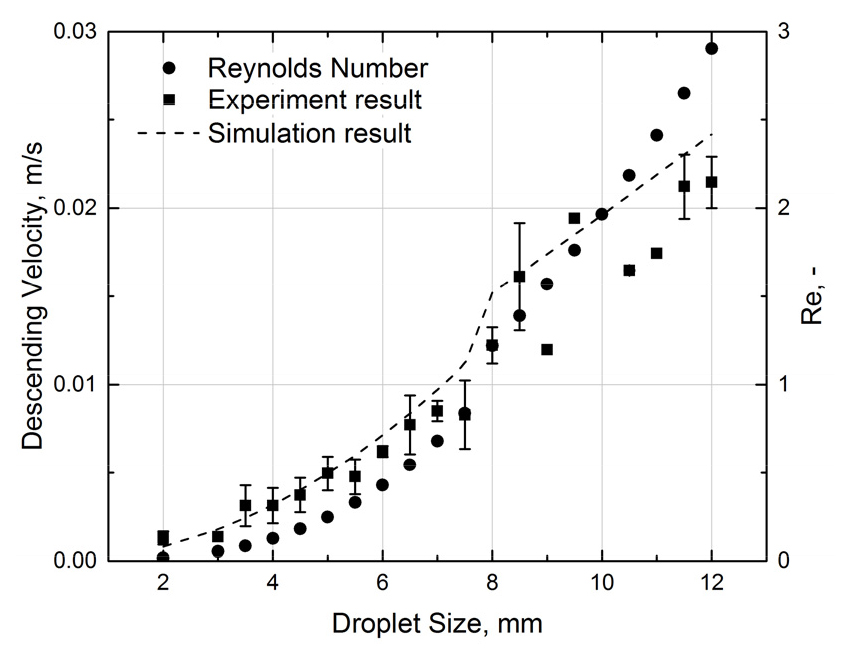
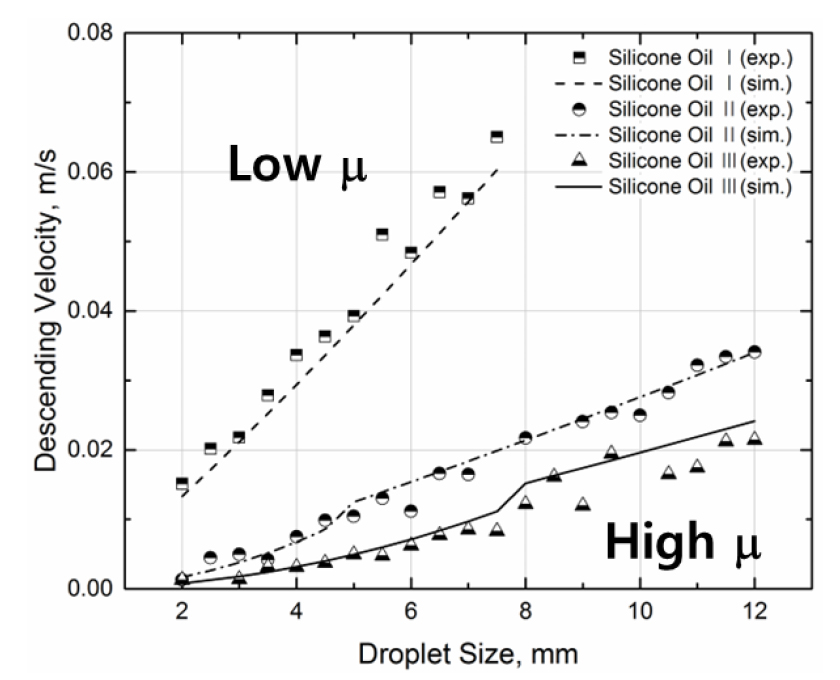
By using silicone oils I, II, and III, the influence of the viscosity and droplet size on the descending velocities of the droplets was investigated and simulated without stirring. Fig. 5 shows the descending velocity of water droplet in silicone oil I as a function of the droplet diameter. The diameter of the water droplet varied from approximately 2 to 8 mm. The measured descending velocities were calculated using the momentum balance model and CD along with the Reynolds number based on the experimental conditions. The descending velocity of the droplets increased with the droplet diameter, where the measured values were in good agreement with the simulated values. Fig. 6 shows the descending velocity of the droplets using silicone oil II; the diameter of the droplets was in the range of 2–12 mm. Although the descending velocity of the water droplets increased with increasing diameter, the velocity was lower than that in silicone oil I owing to the higher oil viscosity. Changes in the simulated velocity were observed for droplets with a diameter of approximately 5 mm because the drag coefficient changed from 24/NRe to 18.5/NRe0.6 when the Reynolds number (see Eq. (5)) increased by more than unity. A similar increment in the descending velocity was observed with silicone oil III when the particle diameter reached 8 mm and the Re number was higher than 1 as shown in Fig. 7. For silicone oil III, the Reynolds number was lower than 2 when the diameter of the droplet was increased to 12 mm, as shown in Fig. 7. The calculated velocity of the droplets was in good agreement with the measured values. Fig. 8 compares the simulation results with the experimental results of the descending velocity of the droplets in silicone oils I, II, and III. In Table 1, the viscosity of silicone oil increased in the order: I < II < III, from 9 to 96 cP (0.009-0.096 Pa∙s). The descending velocity of the droplet increased as the viscosity ratio decreased and the droplet size increased. The descending velocities of the water droplets at a viscosity ratio of 0.096 were at least twice as fast as those at a viscosity ratio of 0.009. From the simulation results, incremental changes in the descending velocity were observed when the droplet size was in the range of 5–8 mm for a viscosity ratio of 0.018 and a viscosity ratio of 0.009 for water and silicone oil. As shown in Eq. (5), the relationship between the Reynolds number and droplet size is governed by the slag viscosity at a constant value of the descending velocity and the slag density. As shown in Fig. 8, the increasing tendency in descending velocity of the water droplet could be similarly observed in both silicone oils II and III as the droplet size increased. This implies that the viscosity of silicone oil has a significant impact on the increase in the drag coefficient in relation to the Reynolds number. Furthermore, because the descending behavior of iron droplets in the viscous slag phase is related to metal loss in the slag, it is necessary to investigate the influence of fluid flow on the descending velocity of the droplet in viscous silicone oil with a lower viscosity ratio.
4.2. Flow of silicone oil by PIV
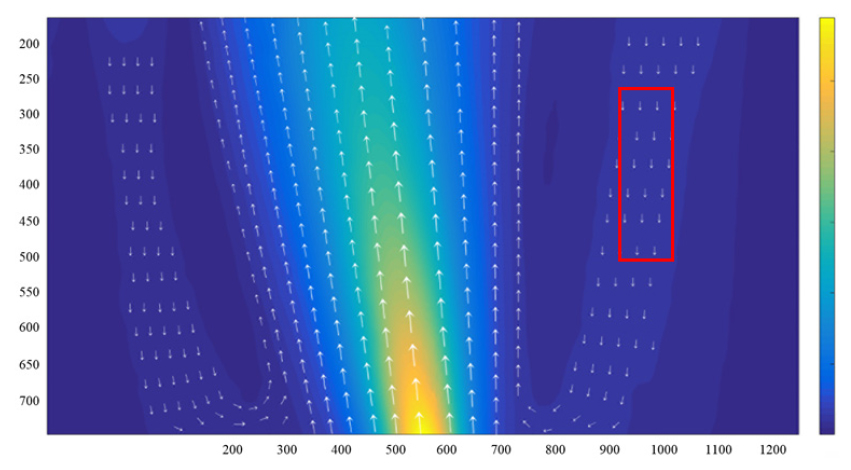
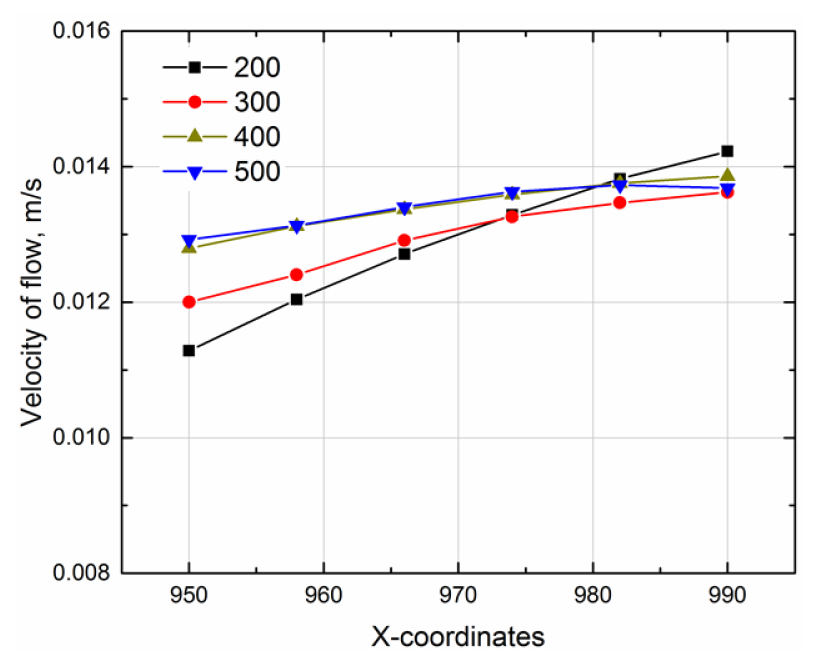
Fig. 9 shows the 2D flow of silicone oil observed using PIV. The horizontal and vertical values are the “x” pixel coordinates and “y” pixel coordinates, respectively. In Fig. 9, the velocity scale is on the right, which indicates that a yellow color corresponds to the maximum velocity at the outlet of the submersible pump, and the region of blue color represents the fluid with the lowest velocity. As shown in the Fig. 9, the droplet moved in the direction of the white arrow; the rectangle indicates the area where the droplet settled in the silicone oil. Furthermore, in the descending area of the droplet, the velocity of the silicone oil was almost constant, as observed using PIV. Fig. 10 shows the obtained velocity of silicone oil III in the descending area at the constant y coordinate (height of oil) as a function of the x coordinate (distance from the pump). At a constant height of silicone oil, the velocity of the silicone oil increased slightly as the distance from the pump increased. The velocity range of silicone oil was approximately 0.011–0.014 m/s, and the average velocity was assumed to be 0.0125 m/s. Based on the average velocity, the udr,0 term in Eq. (7), was used in this study.
4.3. Measurement and model predictions of descending velocity of droplets with stirring
Fig. 11 shows the influence of the diameter of the water droplet on the descending velocity in silicone oil III under stirring. When droplets with the same diameter moved in recirculating flow of oil, the trajectories of the droplet changed continuously due to the movement of silicon oil. For this reason, the descending distance and time of water droplets with the same diameter were measured ten times to obtain the measured descending velocity. As shown in Fig. 11, at a constant diameter, the fluctuations in the measured descending velocity were not significant. These results indicate that the average descending velocity increased with increasing the water droplet size.
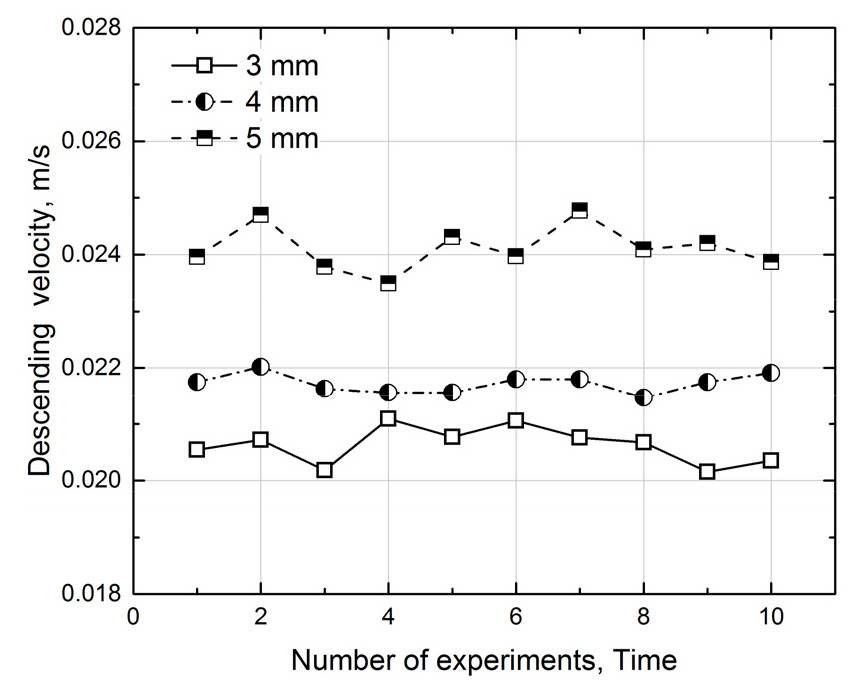
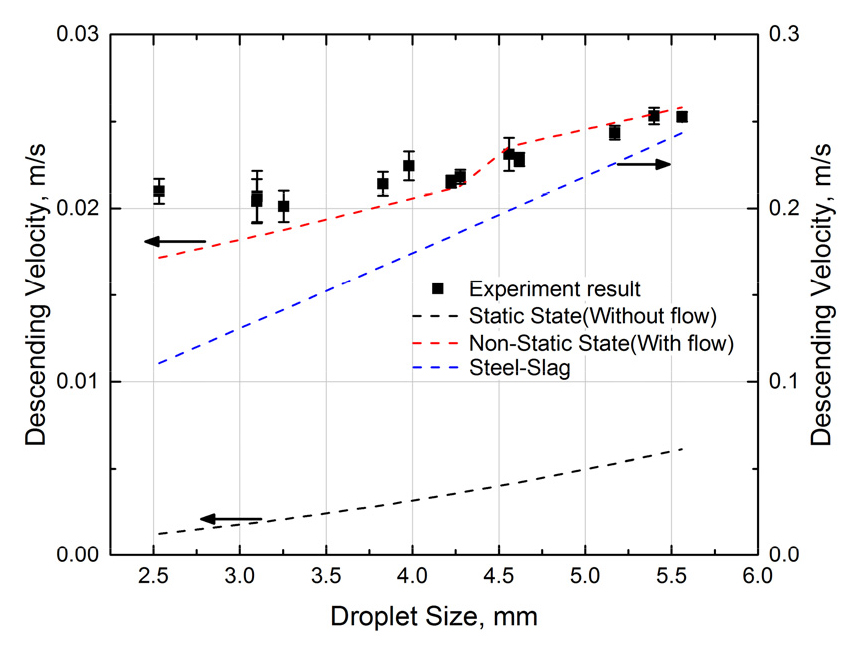
Fig. 12 shows the influence of the droplet diameter on the descending velocity with and without the fluid flow of silicone oil III. The descending velocity of the droplets under stirring conditions was simulated using Eqs. (7) and (8), where the average velocity was 0.0125 m/s, as determined for silicone oil in Section 4.2. Under stirring conditions, the descending velocity of the droplets was approximately five times faster than that without stirring, as shown in Fig. 7. The calculated values obtained using the flow velocity of oil were similar to the measured values, and were faster than the calculated descending velocity without stirring. By applying Eqs. (1),(2),(3),(4) and the Reynolds number, when ρd, ρs, and ms are substituted into the equations based on the density and viscosity of iron and slag in Table 1, the simulated descending velocity of the iron droplets can be obtained as shown in Fig. 12. Although the flow velocity of the slag was assumed to be 0.0125 m/s, the obtained descending velocity of the iron droplets was approximately 10 times larger than that of the water droplets, and increased with the droplet diameter. In a previous study19), it was reported that the descending velocity of an iron droplet increased with increasing droplet diameter, where the velocity was 0.15 m/s for a 3.8 mm droplet. Therefore, it was confirmed that the effect of droplet size on the simulated descending velocity in the present study is similar to that reported in previous studies. Furthermore, when the flow rate of the molten slag can be determined from the actual process, the descending velocity of the iron droplet can be predicted using the force-balance model.
5. Conclusion
The effects of the viscosity and droplet size on the descending velocity of droplets were investigated by a cold model using distilled water and silicone oils with different viscosities. To simulate the descending velocity of the droplet in in a moving fluid, the flow rate of silicon oil was measured by PIV, after which the descending velocity of the droplet was calculated using the force balance model, and the average velocity of the descending flow of silicone oil. The results of the experiments are summarized as follows:
1) The descending velocity of droplets increases with increasing the water droplet diameter and decreases as the viscosity of silicone oil increased. The velocity of a water droplet in a static fluid of low viscosity increased from about 0.02 m/s to 0.06 m/s by increasing the droplet size from 2 to 7 mm, however, in a fluid of higher viscosity, it is required to increase the droplet diameter to 12 mm to reach 0.02 m/s.
2) When the viscosity ratio of water to silicone oil was lower than 0.018, the calculated drag coefficient changed because the Reynolds number was larger than unity. The descending velocity of the droplets simulated using the force balance model and drag coefficients showed good agreement with the measured values for the three types of silicone oil without stirring.
3) Using PIV, the flow rate of viscous silicone oil was measured, and the average flow rate of viscous silicone oil was obtained in the region where the water droplets settled. At a constant diameter, the fluctuations in the measured descending velocity were not significant in water/oil system.
4) The descending velocity of water droplets in a fluid under stirring conditions is higher due to added effect of the velocity of the fluid. By applying the average flow rate of viscous silicone oil to the relative velocity term of the force balance model, the simulated descending velocity of the droplet was similar to the measured value and could be predicted even in the fluid flow.
