

1. Introduction
2. Thermodynamic analysis of Ti hydride formation
3. Experimental
4. Results and discussion
4.1. The influence of temperature on the production of Ti hydride powder
4.2. The influence of sintering time on the O concentration of Ti hydride powder
5. Conclusions
1. Introduction
Titanium (Ti) is widely used in the aerospace, chemical, and medical industries due to its outstanding properties, such as high specific strength, excellent corrosion resistance, and exceptional biocompatibility. Additionally, the mineral resources of Ti are abundant1). Nonetheless, its commercial applications are still limited mainly to the aerospace industry owing to the high manufacturing cost. In addition, a large amount of scrap is generated during the manufacturing of the final Ti products2,3,4,5).
The Kroll process is a commercial method for the production of Ti metal, called Ti sponge6). In this Kroll process, high-purity Ti metal is obtained by the reduction of titanium tetrachloride (TiCl4) with magnesium (Mg) metal. However, the Kroll process is an energy-intensive and time-consuming batch operation. For example, one ton/day of Ti sponge is produced per retort4). In addition, iron (Fe), present in the steel reactor, diffuses into the Ti sponge. This contaminated part, called off-grade Ti sponge, accounts for approximately 10~20 % of Ti sponge production4,5) and cannot be used as a raw material for the production of Ti and its alloys.
Various studies have been performed to develop a new Ti production process as an alternative to the Kroll process2,4). Among the studies, the investigation with the aim of direct production of Ti powder is receiving attention these days owing to the advent of additive manufacturing and the development of near-net-shape manufacturing technologies in the field of the powder metallurgy (PM) process. Owing to the near-net-shape manufacturing by PM process, melting, mill processing, and machining used in the conventional process are not required to produce the final Ti product. As a result, a significant cost saving is attained by reducing the generated scraps and the number of processing steps2,7).
However, the expensive price of Ti powder is one of the main hurdles of the PM processes7,8). Ti powder is produced using a Ti sponge, bar, or wire as the raw material. In order to produce Ti powder in the commercial method, hydride/dihydride (HDH), plasma rotating electrode process, gas atomization, plasma atomization, or electrode induction gas atomization are required7,9). As a result, the process cost for producing Ti powder increased. However, the process cost can be reduced significantly if Ti powder is obtained directly through the Ti metal production process. Therefore, the development of a direct production process for Ti powders is important.
Numerous studies have been conducted to directly produce Ti hydride or Ti powder from TiCl4 using various reducing agents, such as lithium (Li)10), sodium (Na)11,12,13,14,15), Mg16,17,18,19,20,21,22,23,24,25,26,27,28,29,30,31,32), calcium hydride (CaH2)32) or hydrogen plasma33,34), as shown in Table 1. Additionally, titanium dichloride (TiCl2)30,31) has been used with the use of various molten salts, such as magnesium chloride (MgCl2)16,17,18,19,20,21,30,31), calcium chloride (CaCl2)19), potassium chloride (KCl)10,30,31), lithium chloride (LiCl)10,31), and/or sodium chloride (NaCl)31,32). However, the direct production of Ti hydride powder from TiCl4 has rarely been reported even though the production of Ti hydride powder rather than pure Ti powder has several advantages for the PM process32,35,36).
Table 1
Results of various studies on direct production of titanium or titanium hydride powder from TiCl4 conducted in the past2,7,10,11,12,13,14,15,16,17,18,19,20,21,22,23,24,25,26,27,28,29,30,31,32,33,34,35,36)
|
Process identifier |
Reducing agent | Feed | Flux |
Temp., T / K | Product | Ref. | ||||
| Type | Feeding method |
Feeding rate, f / g·h-1 | Type |
Particle size, d / μm | Mass Pct O | |||||
|
Li in salt agitation | Li (l) | TiCl4 (l) |
Poured into Li/LiCl bath | 1800 | KCl-LiCl | 773 | Ti | 100 – 1000a | – | [10] |
| Hunter | Na (l) | TiCl4 (l) |
Placed in a reactor with Na | – | Not used | > 1073 | Ti | < 149 or < 250 | – | [7,11,12] |
| Armstrong | Na (l) | TiCl4 (g) |
Injected into Na (l) stream | – | Not used | – | Ti | – | 0.12 – 0.23 | [2,7,13] |
| ARP | Na (l) | TiCl4 (g) |
Injected into Na (l) aerosol | – | Not used | 1373 – 1473 | Ti | – | – | [14,15] |
| CSIR-Ti | Mg (l) | TiCl4 (l) |
Reduced with Ti and transferred into Mg (l) | – |
Ti powder, MgCl2 | 923 – 973 | Ti | 1 – 330 | 0.19 – 0.92 | [16,17,18] |
| TiCl4 injection | Mg (l) | TiCl4 (g) |
Carried into molten salt | 1 – 47 | MgCl2, CaCl2 | 1083 – 1173 | Ti | 1 – 8 | 0.54 – 2.30 | [19] |
| TNK | Mg (l) | TiCl4 (l) |
Carried into Mg/MgCl2 | 600 | MgCl2 | 1053 – 1173 | Ti | 13.9b | 0.34 – 5.80 | [20,21] |
| Spray reaction | Mg (l) | TiCl4 (g) |
Sprayed into Mg (l) stream | 23400 | Not used | 923 | Ti | 10 – 40c | 0.25 – 1 | [22] |
|
Gaseous reaction | Mg (g) | TiCl4 (g) |
Flowed into Mg vapor | 162 | Ti ribbons | 1173 – 1223 | Ti | – | – | [23,24] |
|
Vapor reduction | Mg (g) | TiCl4 (g) |
Carried into Mg vapor | – | Not used | 1273 | Ti | 1 – 2d | 0.36e | [25] |
| TiRO | Mg (s) | TiCl4 (g) |
Carried into fluidized bed | 400 – 1090 | Not used | 933 – 963 | Ti | 200f | < 0.25 | [26,27, 28,29] |
| TiLAC | Mg (l) | TiCl2 |
Added into molten salt | – | MgCl2, KCl | < 1023 | Ti | – | – | [30] |
| Suzuki et al. | Mg (l) | TiCl2 | Placed in crucible | – |
LiCl, MgCl2, NaCl, KCl | 973, 1173 | Ti | < 100g | 1.60 – 3.40 | [31] |
|
Mechano- chemical processing |
Mg (s) or CaH2 (s) | TiCl4 (l) |
Added to pre-milled Mg and NaCl mixture | – | NaCl powder | 298 | TiH2 | Nano-sizeh | – | [32] |
|
Plasma quench | H2 plasma | TiCl4 (g) |
Carried into H2 plasma | 5 – 26 | Not used | > 5000 | Ti | Nano-sizei | – | [33,34] |
| ADMA | Mg (l), H2 (g) | TiCl4 (g) |
Injected into Mg liquid | –j | TiH2 powder | 1023 – 1123 | TiH2 | < 250 | 0.05 – 0.10 | [35,36] |
a : 83 % of the particles were from 100 μm to 1 mm in size, 14 % were smaller than 100 μm and 3 % were larger than 1 mm.
c : Median diameter of Ti product after grinding. Before grinding, 30 – 50 % of the particles were from 75 μm to 150 μm in size, 30 – 60 % were smaller than 75 μm and 10 – 20 % were larger than 150 μm.
d : Ti powder particles obtained by vacuum distillation; The particle size of the powder obtained by leaching was 300 – 700 nm.
e : Ti powder particles obtained by vacuum distillation; The oxygen concentration of the powder obtained by leaching was 0.82 mass%.
g : The particle size was varied as a function of the reaction time; < 1 μm, 10 – 30 μm, and 50 – 100 μm when the reaction time was 5 min, 6 h, and 24 h, respectively.
In the PM process, using Ti hydride powder is preferred because it results in the improved mechanical properties of Ti components7,37,38). When Ti hydride powder is used as a raw material in the conventional pressing, the density of the sintered compact increases owing to the brittleness of the Ti hydride powder. Additionally, the dehydrogenation of the hydride powder by vacuum sintering improves densification. As a result, a Ti hydride powder provides higher sintered density to the sintered compact than a pure Ti powder without additional costly pressure-assisted consolidation techniques. The low residual porosity of the sintered compact with increasing density improves the fatigue properties of the final Ti product. Therefore, because using Ti hydride powder in PM processes can improve the mechanical properties of the final Ti products cost-effectively, a decrease in the production cost of the Ti hydride powder is important.
One promising method for the direct production of Ti hydride powder from TiCl4 is the ADMA process, developed by Advance Materials Inc. (ADMA Products Inc.). In this process, the concentrations of oxygen (O) and hydrogen (H) in the product were reported in the range of 0.05~0.10 mass% and 3.32~3.64 mass%, respectively35,36). Although the ADMA process demonstrated the production of a high-quality TiH2 powder, a systematic investigation of the magnesiothermic reduction of TiCl4 in an hydrogen gas (H2) atmosphere was not reported.
In this study, the influence of temperature on the formation of Ti hydride during the magnesiothermic reduction of TiCl4 in an H2 gas atmosphere was investigated because the dissolution of H into Ti is strongly affected by temperature and hydrogen partial pressure (pH2) in the reaction system. In addition, the concentration of O in Ti and Ti hydride is significantly affected by the specific surface area of the powder owing to the nano-scale oxide layer on the surface of the powder. Furthermore, the influence of sintering on the O concentration of powder was investigated because the specific surface area can be decreased by densification and/or coarsening of the particles during sintering. Moreover, a dropping funnel was used in this study instead of a carrier gas to gradually inject TiCl4 into the Mg metal. This is because the actual temperature inside the reactor, which strongly affects Ti hydride formation, is considerably influenced by the TiCl4 feeding rate owing to the exothermic reaction of magnesiothermic reduction of TiCl4.
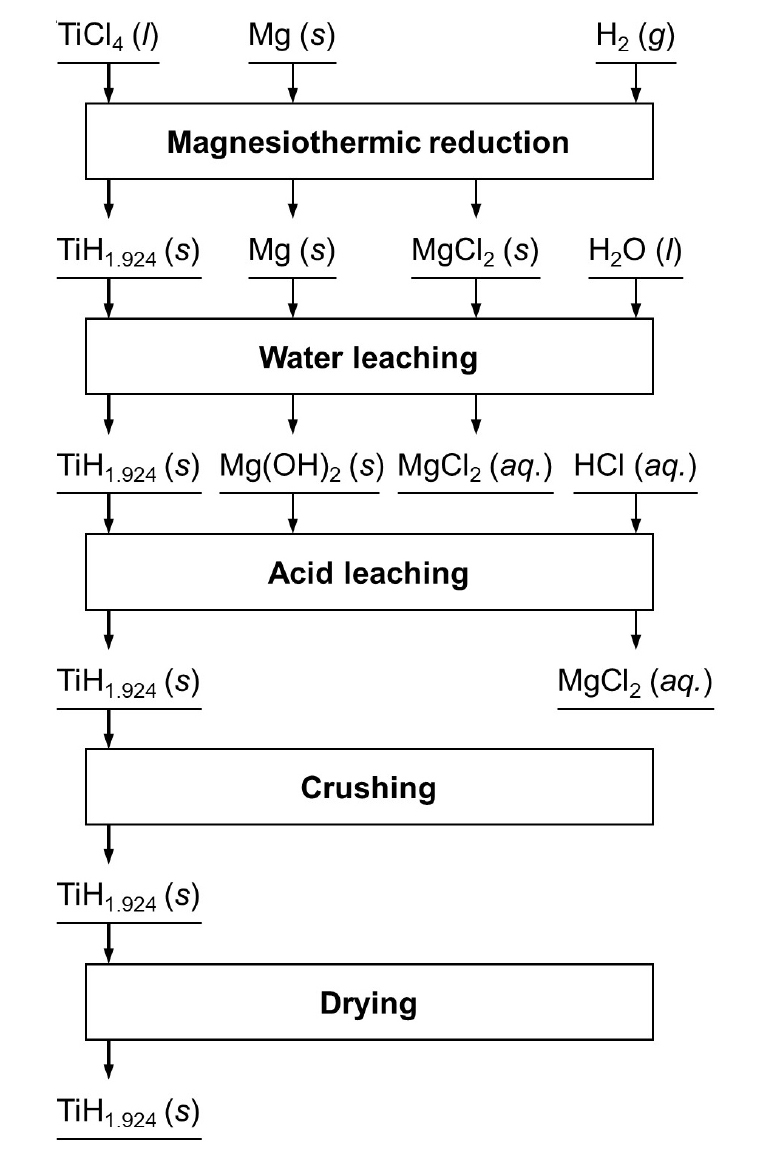
Fig. 1 shows the process flowchart of Ti hydride powder production in this study. As shown in Fig. 1, in order to focus the studies on the influence of temperature and sintering on the Ti hydride formation in the reduction step, leaching was performed instead of vacuum distillation, which was used in the ADMA process, for removal of the residual Mg and MgCl2 produced by the magnesiothermic reduction.
2. Thermodynamic analysis of Ti hydride formation
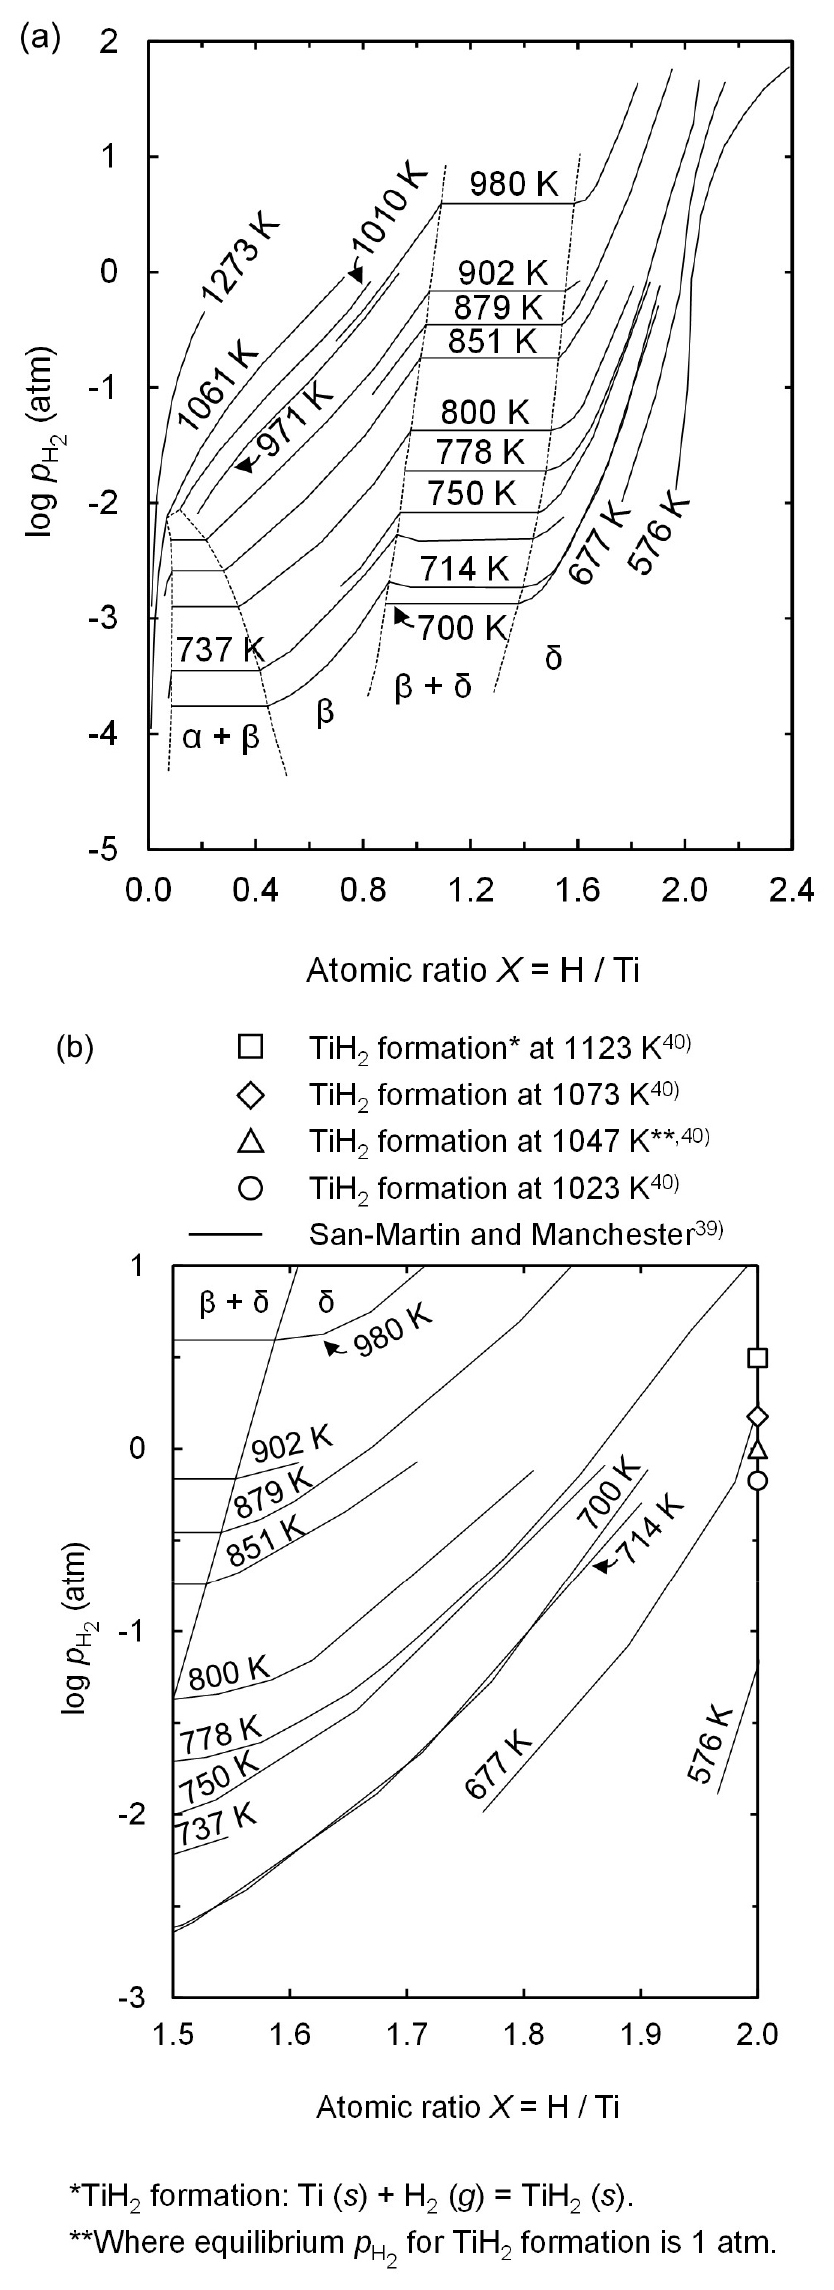
Fig. 2 (a) shows the assessed Ti – H phase diagram39). The equilibrium composition of Ti hydride, formed at given pH2 and temperature of the reaction system, was determined using this phase diagram. The diagram was plotted with the atomic ratio of H to Ti as the abscissa and pH2 as the ordinate. This diagram represents various phases, such as α, α + β, β, β + δ, and δ and the stability regions of these phases are divided by broken lines, depending on the atomic ratio of H to Ti and pH2. The solid lines show the isothermal variations of the equilibrium pH2 at 576~1273 K as a function of the atomic ratio of H to Ti.
In order to investigate the formation of TiH2, the Ti – H phase diagram for the δ-Ti hydride region where an atomic ratio of H to Ti ranges from 1.5 to 2.0 was redrawn as Fig. 2 (b)39). Furthermore, the equilibrium pH2 for the formation of TiH2 at the experimental temperatures were calculated using Eq. (1) with the thermochemical data reported by Barin40) and shown in Fig. 2 (b).
∆G°r < 0 when T > 1047 K under pH2 = 1 atm40)
As shown in Fig. 2 (b), the atomic ratio of H to Ti increases with decreasing temperature at identical pH2. Moreover, Fig. 2 (b) shows that the temperature should be lower than 677 K under 1 atm of pH2 for the stability of TiH2 according to the thermodynamic data on Ti – H phase diagram reported by San-martin and Manchester39). This indicates that TiH2 is difficult to obtain after the magnesiothermic reduction of TiCl4 in an H2 gas atmosphere at experimental temperatures of 1023~1123 K used in this study. However, when the thermodynamic data reported by Barin is used40), the equilibrium pH2 for TiH2 formation is 0.84 atm at 1023 K. This indicates that TiH2 can be obtained after the magnesiothermic reduction of TiCl4 in an H2 gas atmosphere at 1023 K. Therefore, to consider the equilibrium composition of Ti hydride produced at 1023~1123 K in an H2 gas atmosphere both thermodynamic data were utilized in this study.
3. Experimental
Fig. 3 shows a schematic of the experimental apparatus used in this study. Mg metal (ingot, purity: 99.9 %, Silica Trading Co., Ltd.) was used as a reducing agent and was placed inside an Fe crucible (O.D. (ϕ) = 76.3 mm, thickness (t) = 5.2 mm, height (h) = 200 mm). The Fe crucible was placed inside a stainless steel (SUS) reactor (O.D. (ϕ) = 142 mm, thickness (t) = 6 mm, height (h) = 493 mm), and the lower end of a quartz (SiO2) tube for the injection of TiCl4 was positioned at a distance of 100 mm from the upper end of the Fe crucible. After the TiCl4 injection tube was assembled with a dropping funnel and flange, this assembly was set up in the reactor, and the reactor was placed inside an electric furnace.
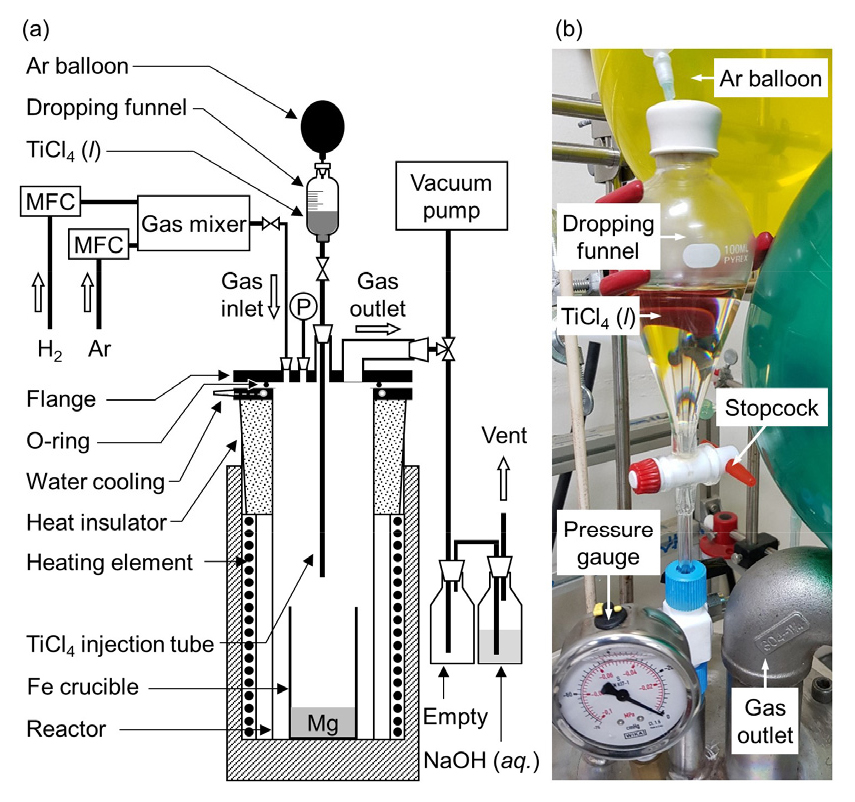
The reactor and dropping funnel were purged thrice before heating via vacuum evacuation for 15 min followed by the filling with argon gas (Ar, purity: 99.999 %) to an internal pressure of 1 atm. Subsequently, the reactor was heated to 473 K in an Ar gas atmosphere, and the interiors of the reactor and dropping funnel were purged again thrice at 473 K. Then, the reactor was heated to 1023 K, 1073 K, or 1123 K in an Ar gas atmosphere. When the temperature reached the desired value, the Ar gas flow was stopped, and H2 (purity: 99.999 %) gas flowed into the reactor at 300 sccm for 30 min using a mass flow controller (MFC), while maintaining an internal pressure of 1 atm. During this time, the stopcock below the dropping funnel was closed, and TiCl4 was transferred from the reagent bottle to the dropping funnel using an Ar gas-purged syringe. In addition, an Ar gas-filled balloon was kept on the top of the dropping funnel. After flowing H2 gas for 30 min, TiCl4 was injected by opening the stopcock situated below the dropping funnel.
When the TiCl4 injection was completed, the reactor was maintained at the desired temperature for 0~120 min for sintering Ti hydride powders produced. After sintering, the reactor was cooled to 298 K. During cooling, the reactor was sealed without any gas supply or emission.
Subsequently, water leaching followed by hydrochloric acid (HCl) leaching was conducted to remove the residual Mg and MgCl2 from the residues left in the Fe crucible. First, the Fe crucible containing the residues was leached using distilled water at 298 K for 24 h without stirring and then filtrated. Subsequently, the residues separated from the Fe crucible were leached using 1 M HCl solution at 298 K for 2 h with stirring at 300 rpm and filtrated. The obtained residues were then rinsed with distilled water, followed by ethyl alcohol, and dried at 298 K for 1 h in air. Finally, the obtained samples were crushed using a mortar and pestle.
The crystalline phases of the samples were identified using X-ray diffraction (XRD: Panalytical, EMPYREAN, Cu-Kα radiation or Rigaku, D/Max-2500, Cu-Kα radiation). The concentrations of H and O in the samples were analyzed using an O/N/H determinator (Eltra, ONH2000) and O/N determinator (Eltra, ON900), respectively. The specific surface areas of the samples were analyzed using a surface area and pore size analyzer (BET: Quantachrome, Quadrasorb Evo). The surface morphologies of the samples were analyzed using field-emission scanning electron microscopy (FE-SEM: Hitachi, SU8220) and field-emission transmission electron microscopy/energy-dispersive X-ray spectroscopy (FE-TEM: FEI Company, Titan G2 ChemiSTEM Cs probe/four SDDs windowless Super-X).
4. Results and discussion
4.1. The influence of temperature on the production of Ti hydride powder
Table 2 lists the experimental conditions used in this study for the magnesiothermic reduction of TiCl4 in an H2 gas atmosphere. Figs. 4, 5, and 6 show the results of the XRD analysis, the concentrations of O and H, and the FE-SEM images, respectively, of the residues obtained from the center of the Fe crucible after the magnesiothermic reduction at 1023 K, 1073 K, and 1123 K in an H2 gas atmosphere when the sintering time was 120 min. Although Mg and produced MgCl2 are evaporated at given temperatures, the pH2 in the reaction system was estimated to be 1 atm. This is because Mg and MgCl2 vapors were removed from the system by condensation at low-temperature regions and also a continuous H2 gas was supplied into the reactor.
Table 2
Experimental conditions used in this study
|
Exp. no.a |
Reaction temp., T / K |
Sintering time, tsinter / min | TiCl4 feed |
Weight of Mg, wMg / g |
Molar ratio of Mg / TiCl4, n | |
| Rate, fTiCl4 / g·min-1 | Feeding time, tTiCl4 / min | |||||
| 191020 | 1023 | 120 | 3.42 | 30.28 | 40.75 | 3.07 |
| 191022 | 1073 | 120 | 3.56 | 29.08 | 40.38 | 3.04 |
| 191106 | 1123 | 120 | 3.53 | 29.37 | 40.11 | 3.02 |
| 190919 | 1023 | 0 | 3.32 | 31.17 | 40.45 | 3.05 |
| 190921 | 1023 | 30 | 3.57 | 29.02 | 40.66 | 3.06 |
| 191018 | 1023 | 60 | 3.52 | 29.40 | 40.60 | 3.06 |
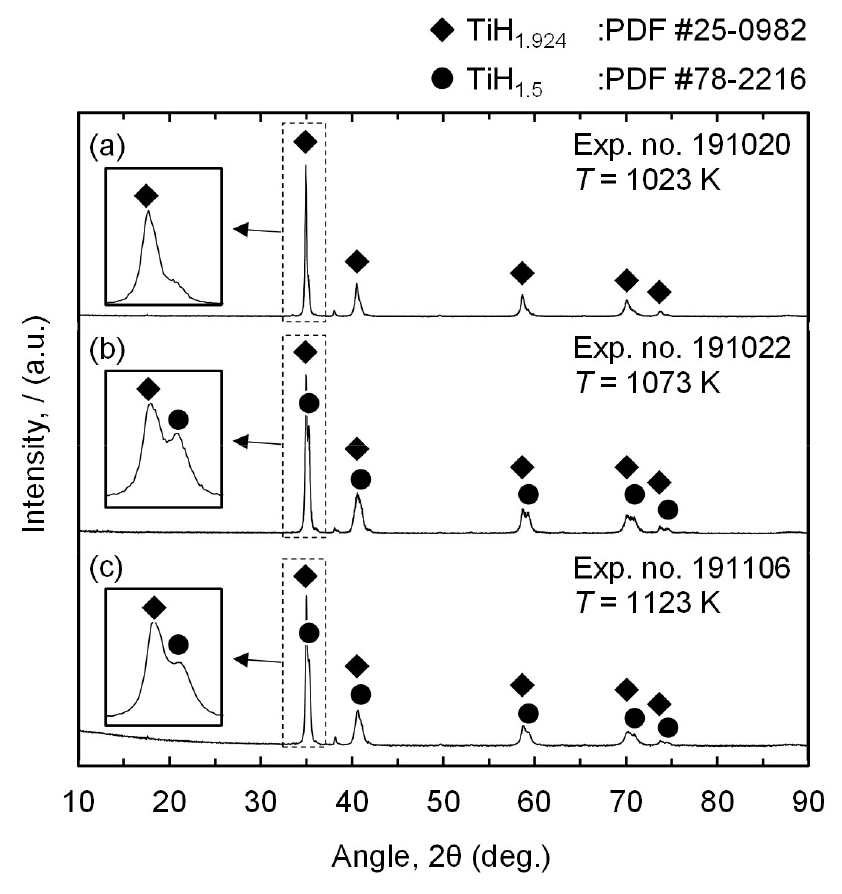
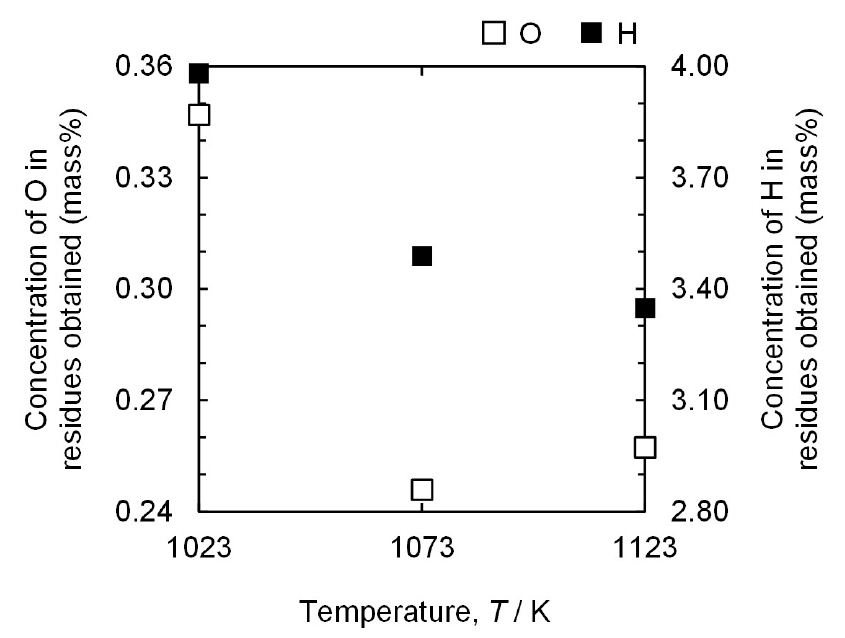
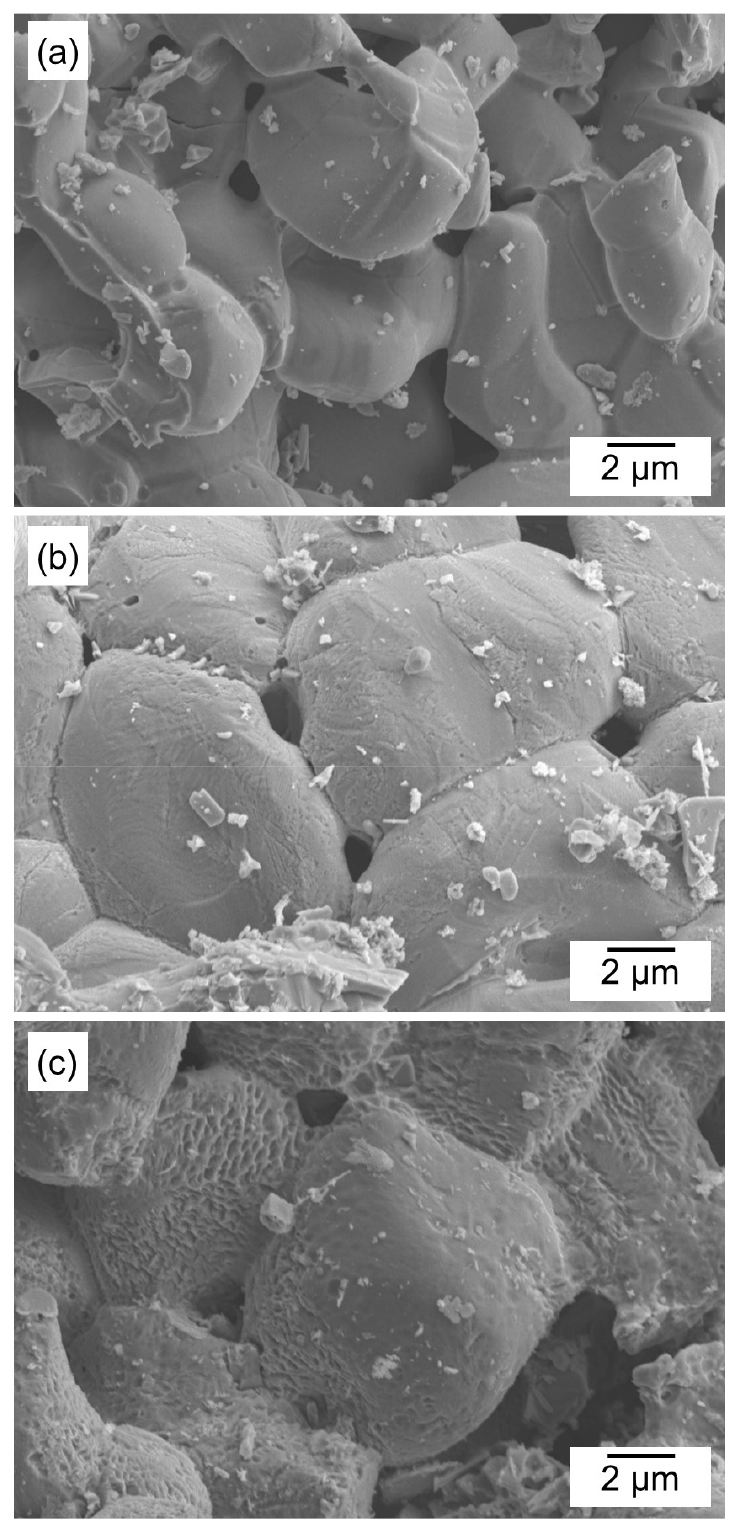
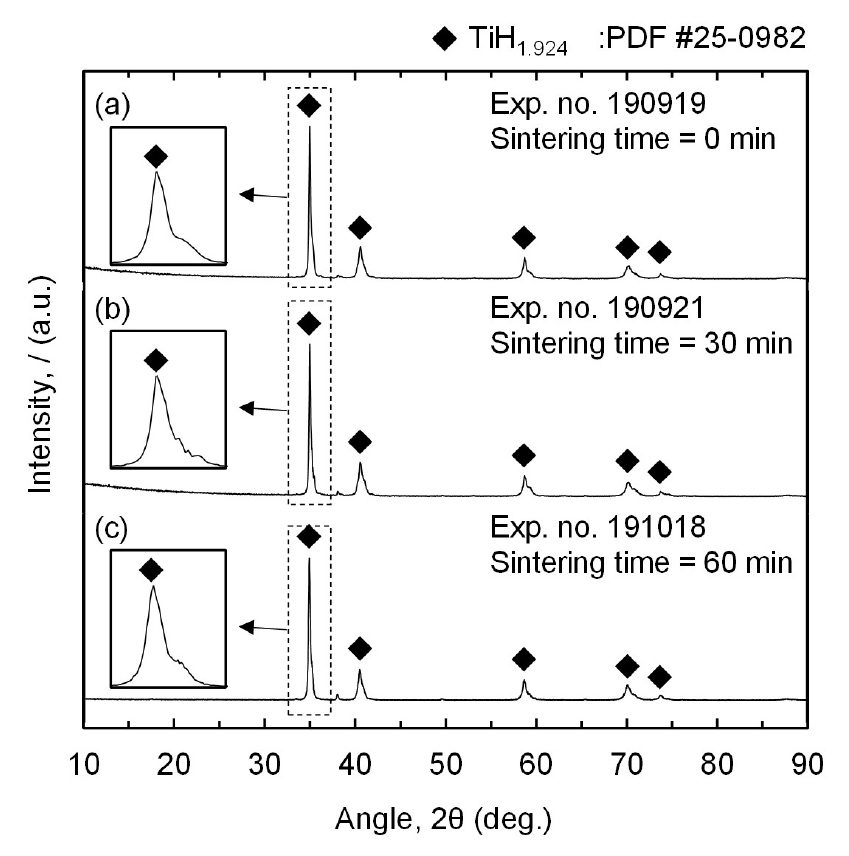
Fig. 4 shows that the mixture of TiH1.924 and TiH1.5 or TiH1.924 was produced by the magnesiothermic reduction of TiCl4 in an H2 gas atmosphere. Therefore, the overall chemical reactions are expressed in Eqs. (2) and (3). In addition, peaks of Mg and MgCl2 are not observed in Fig. 4, indicating the complete removal of the residual Mg and MgCl2 from the residues. Eqs. (4) and (5) show that residual Mg is converted to magnesium hydroxide (Mg(OH)2) during water leaching, which is subsequently converted to an aqueous MgCl2 solution by reacting with HCl during acid leaching. Additionally, residual MgCl2 is dissolved in water. Therefore, both residual Mg and MgCl2 were removed as an aqueous MgCl2 solution during leaching.
∆G°r = – 323.2 kJ at 1023 K40)
∆G°r = – 298.6 kJ at 1123 K40)
∆G°r = – 359.4 kJ at 298 K41)
∆G°r = – 103.7 kJ at 298 K41)
Furthermore, the production of TiH1.924 in Fig. 4 (a) is in line with the thermodynamic analysis in Fig. 2 (b) using the data reported by Barin40), which demonstrates that TiH2 is produced at 1023 K and pH2 of 1 atm under equilibrium conditions. In contrast, a mixture of TiH1.5 and TiH1.924 is found when the experiments were conducted at 1073 K and 1123 K, as shown in Figs. 4 (b) and (c), respectively. This is because when a temperature is higher than 1047 K, partial thermal decomposition of TiH2 occurs despite pH2 of 1 atm.
As shown in Eq. (1), TiH2 decomposes into Ti and H2 gas when the temperature is higher than 1047 K under pH2 of 1 atm. This is because the equilibrium pH2 for TiH2 formation at 1073 K and 1123 K is 1.19 atm and 1.64 atm, respectively, which are higher than pH2 of 1 atm used in the experiments, as shown in Fig. 2 (b). Although the equilibrium composition of Ti hydride formed at 1073 K and 1123 K is difficult to determine owing to the lack of the required information in the thermodynamic data reported by Barin40), the molar ratio of H to Ti in Ti hydride is evident to decrease with increasing temperature when the temperature is higher than 1047 K. As a result, to obtain TiH1.924 powder via the magnesiothermic reduction of TiCl4 in an H2 gas atmosphere, the process was preferred to be conducted at 1023 K rather than 1073 K and 1123 K.
Moreover, the analyzed concentration of H in the residues obtained is in good agreement with the results of the XRD analysis. As shown in Fig. 5, the highest H concentration is 3.98 mass% for the residue obtained at 1023 K, identified as TiH1.924. In addition, for the residues obtained at 1073 K and 1123 K, identified as a mixture of TiH1.5 and TiH1.924, the concentrations of H are 3.49 mass% and 3.35 mass%, respectively. As shown in Fig. 4, only two types of Ti hydrides, TiH1.924 and TiH1.5, are produced. Therefore, the proportions of TiH1.924 and TiH1.5 in the residues were calculated assuming the TiH1.924 as TiH2. Consequently, the proportion of TiH1.924 increased from approximately 29 % to 94 % when the temperature was decreased from 1123 K to 1023 K.
In addition, the concentration of O in the residues obtained decreases with increasing temperature. The concentrations of O are 0.347 mass%, 0.246 mass%, and 0.257 mass% at 1023 K, 1073 K, and 1123 K, respectively. This is because a decrease in the specific surface area of the residues with increasing temperature results in a decrease in the concentration of O in the residues.
In general, the concentration of O in Ti is determined by the presence of O as a solid solution and nano-scale oxide layer on the Ti surface. The influence of the oxide layer on the concentration of O in the Ti powder increases with decreasing particle size. When the sintering effect is strengthened by increasing the temperature, the primary particles are further coarsened and densified. As a result, the sizes of the primary particles increase with increasing temperature. Hence, the concentrations of O in the residues decrease with decreasing specific surface area of the residues.
As shown in Fig. 6, the primary particles of the residues obtained after the experiments at 1123 K and 1073 K are larger than those at 1023 K. Moreover, it is notable that when the surface area of the residues decreases with increasing primary particle size, the influence of contamination during leaching on the concentration of O in the residues decreases. Therefore, the concentrations of O in the residues obtained after the experiments at 1073 K and 1123 K were lower than those at 1023 K owing to the smaller specific surface area of the residues.
4.2. The influence of sintering time on the O concentration of Ti hydride powder
To confirm the influence of the surface area on the concentration of O in the residues obtained, sintering was performed for 30 min and 60 min after the magnesiothermic reduction of TiCl4 in an H2 gas atmosphere was conducted at 1023 K. In addition, the experiment was conducted at a sintering time of 0 min in order to clarify whether the TiH1.924 was produced during the reduction or reduction followed by sintering. The results of the XRD analysis, concentrations of O along with the specific surface area, and FE-SEM images of the residues obtained after the experiments are shown in Figs. 7, 8, and 9, respectively.
Fig. 7 shows that the production of TiH1.924 is independent of the sintering time, indicating that the magnesiothermic reduction of TiCl4 and hydrogenation occur simultaneously. Additionally, the reaction for the production of TiH1.924 is completed before the sintering time is started. Therefore, the sintering time is only responsible for the sintering effect and additional hydrogenation to produce TiH1.924 is not necessary for this process.
The concentrations of O and the specific surface area of the residues obtained decrease with increasing sintering time, as shown in Fig. 8. When the sintering times are 0 min, 30 min, and 60 min, the concentrations of O in the residues obtained are 0.508 mass%, 0.500 mass%, and 0.392 mass%, respectively, and the specific surface areas are 1.7570 m2·g−1, 1.0920 m2·g−1, and 0.7080 m2·g−1 respectively. This is attributed to an enhanced sintering effect with increasing sintering time, which decreases the specific surface area of the residues, resulting in a decrease in the concentration of O.
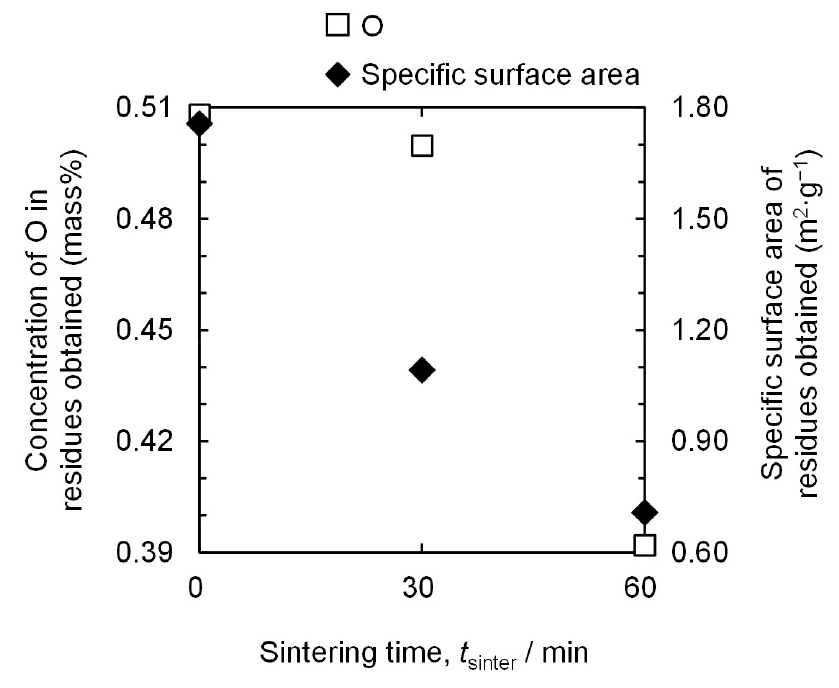
When the sintering time increases, the coarsening and densification of the residues are further advanced owing to a longer residence time of the residues at high temperatures, as shown in Fig. 9. As a result, the sizes of the primary particles of the residues increase with decreasing the specific surface area of the residues. Therefore, the concentration of O in the residue decreased to 0.392 mass% at a sintering time of 60 min.
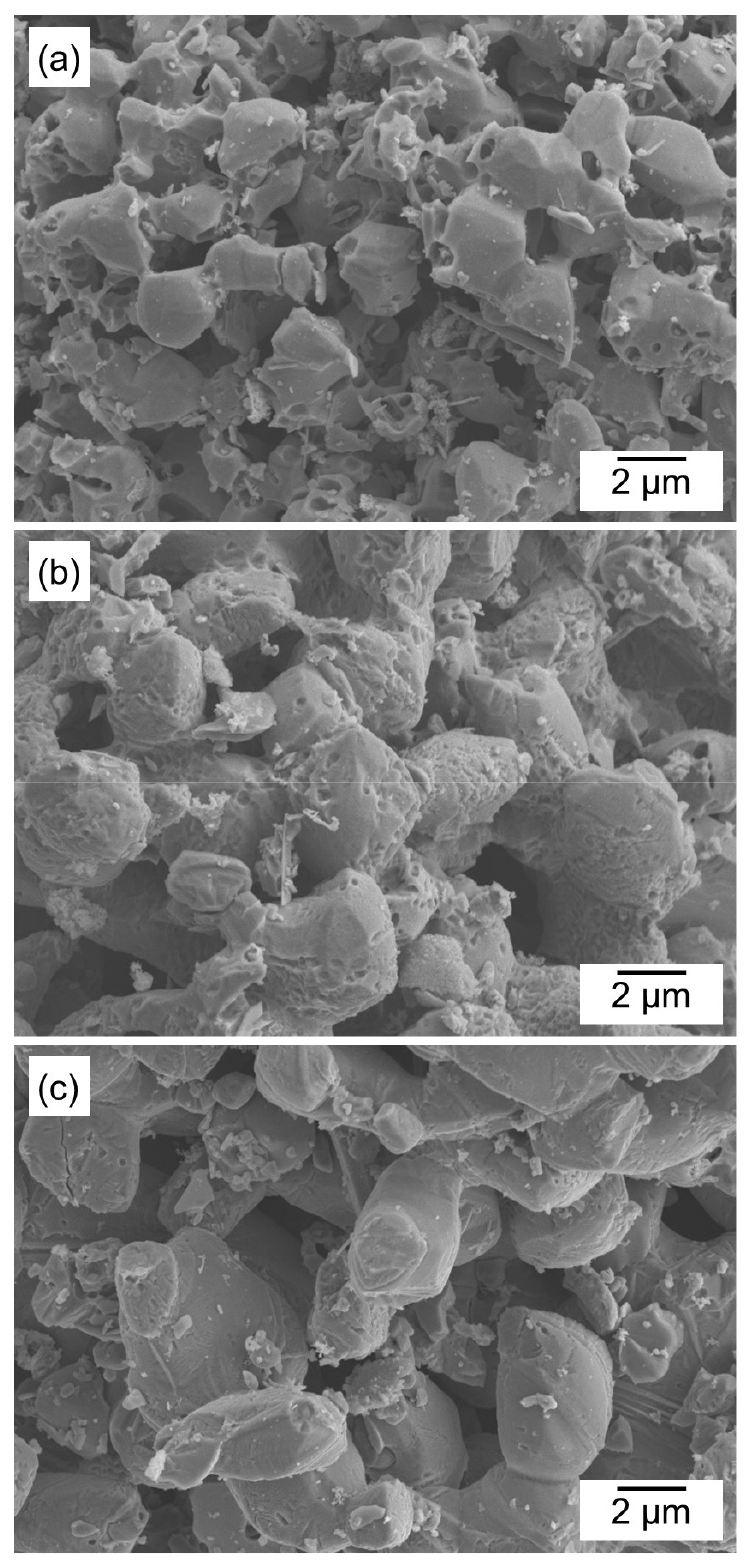
Fig. 10 shows the FE-TEM/EDS images of the residues obtained after the experiment at 1023 K (Exp. no. 190919). Fig. 10 (a) confirms that the residues consist of Ti, and the thickness of the oxide layer on the TiH1.924 particles obtained is in the range of 1~2 nm, as shown in Fig. 10 (b).
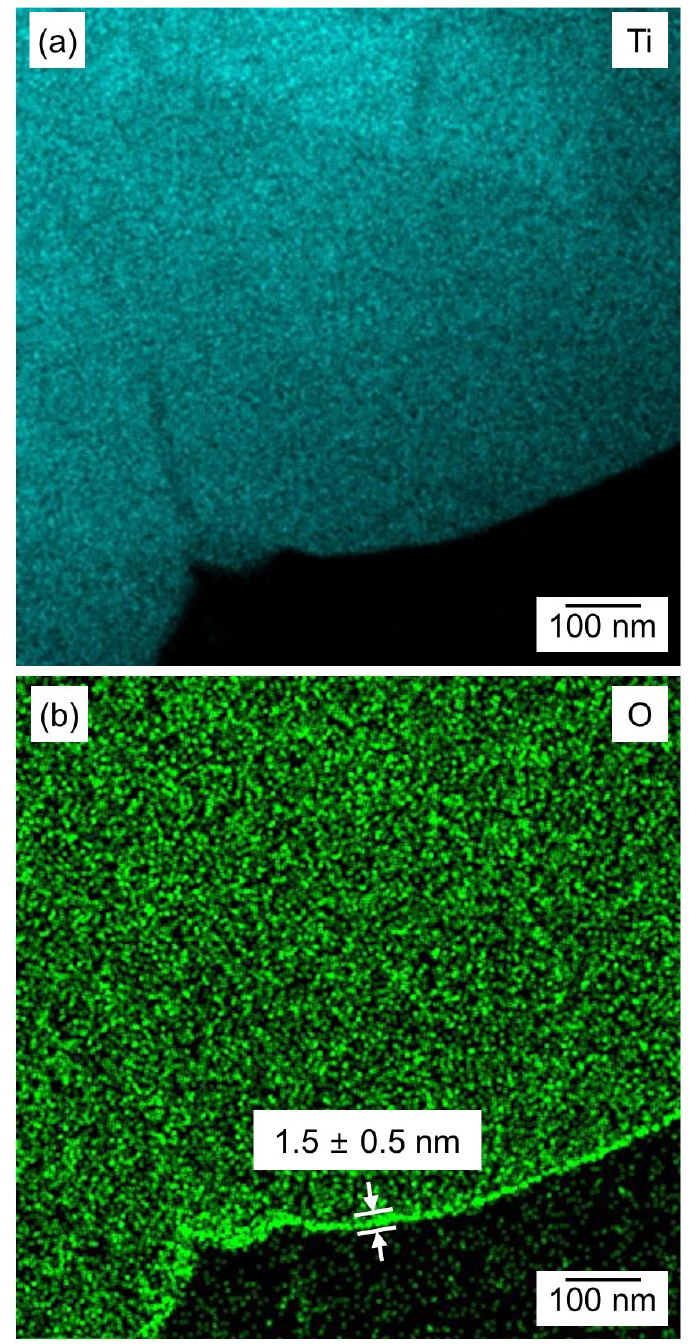
The concentration of O in the obtained TiH1.924 powder is the sum of the concentrations of O in the nano-scale oxide layer and O solid solution. The O concentration in the TiH1.924 powder attributed to the oxide layer decreases with decreasing specific surface area. This is because the volume fraction of the oxide layer decreases with increasing particle size. The experimental results show that the concentration of O in the obtained TiH1.924 powder decreased from 0.508 mass% to 0.392 mass% with decreasing the specific surface area from 1.7570 m2·g−1 to 0.7080 m2·g−1 when the sintering time increased from 0 min to 60 min. Therefore, if the concentration of O attributed to the O solid solution is identical for all experiments, a decrease in the O concentration in the obtained TiH1.924 powder is mainly influenced by the specific surface area.
In order to discuss the concentration of O in TiH1.924 powder attributed to the O solid solution, the determination of the O concentration of Ti – O solid solution was considered. The O concentration of Ti – O solid solution is determined thermodynamically by equilibrating them with the metallic reducing agents (M) and their metal oxides (MOx), as shown in Eq. (6). As a result, the equilibrium O concentration in Ti is expressed as Eq. (7)42,43).
In Eqs. (6) and (7), [O]in Ti is O dissolved in Ti; M is the metallic reducing agent, such as Mg or Ca; MO is a metal oxide, such as MgO or CaO; [mass% O]in Ti is the equilibrium O concentration in Ti (mass%); aMO is the activity of metal oxide; aM is the activity of the metal; γO is the activity coefficient of O in Ti; ΔG° is the standard Gibbs free energy change of Eq. (6).
For the experiments of the Exp. nos. 190919, 190921, and 191018, the value of aMO / aM in Eq. (7) was identical because the amount of Mg metal and TiCl4 used and atmosphere gas were identical when the reactions were assumed to be reached in equilibrium. In addition, O in the Ti – O solid solution was assumed to obey the Henry’s law and 1 mass% O was taken as the standard state. Accordingly, γO was considered as unity. As a result, as shown in Eq. (7), the concentration of O, attributed to the solid solution, was identical even though the sintering time was increased.
These results indicate that the O concentration in the obtained TiH1.924 powder was mainly influenced by the specific surface area when the sintering time was increased. As a result, the concentration of O in the obtained TiH1.924 powder decreased with increasing temperature and sintering time owing to a decrease in the specific surface area of the TiH1.924 powder. These results also demonstrate that the concentration of O in the TiH1.924 powder obtained can decrease further when coarsening and densification will proceed further to decrease the specific surface area of the TiH1.924 powder.
5. Conclusions
The direct production of Ti hydride powder using the magnesiothermic reduction of TiCl4 in an H2 gas atmosphere was systematically investigated. The magnesiothermic reduction was performed at 1023 K, 1073 K, and 1123 K in an H2 gas atmosphere by dropping TiCl4 into Mg metal, followed by sintering for 0 min, 30 min, 60 min, and 120 min. The concentration of H increased with decreasing temperature from 1123 K to 1023 K, resulting in an increase in the proportion of TiH1.924 in the mixture of TiH1.924 and TiH1.5 from 29 % to 94 %. As a result, the pure TiH1.924 was solely produced at 1023 K which was in line with the thermodynamic analysis. Furthermore, the concentration of O decreased with decreasing the specific surface area of the Ti hydride powder. The specific surface area decreased with increasing temperature and sintering time owing to the coarsening and densification of the primary particles of Ti hydride resulting from the sintering effect. Consequently, the concentration of O in the TiH1.924 powder, obtained after the experiment at 1023 K, decreased from 0.508 mass% to 0.347 mass% with increasing sintering time from 0 min to 120 min. In addition, the concentration of O in the Ti hydride powder decreased from 0.347 mass% to 0.246 mass% and 0.257 mass% with increasing temperature from 1023 K to 1073 K and 1123 K, respectively, at a sintering time of 120 min.
