1. 서 론
2. 해외 주요국의 자원생산성 현황 및 정책 추진동향
2.1. 유럽에서의 자원생산성 관리 및 향상 정책
2.2. 일본에서의 자원생산성 관리 및 향상 정책
3. 자원생산성의 국내외 비교 분석
3.1. 국내의 자원생산성 산정
3.2. 해외 주요국의 자원생산성과 우리나라의 자원생산성 비교
4. 우리나라의 자원생산성 제고 방안
5. 결론 및 제언
1. 서 론
산업발전과 함께 에너지, 자원 이용이 증가함에 따라 자원생산성 관리의 중요성이 점차 증가하고 있다. 폐기물 발생 저감 및 순환자원 이용 활성화를 위해서도 자원생산성 관리는 산업 전반으로 확대해 나가야 하는 중요한 관리지표이다.
우리나라의 정부 차원에서 공식적으로 자원생산성 지표에 관한 세부 지침이나 내용을 설정하여 관리하거나 운영해 오지는 않았다. 다행히 2009년에 산업발전법의 개정을 통해 산업계 자원생산성 향상을 위한 법적 근거는 마련하였다. 동 법 제17조에 자원생산성 향상관리에 관하여 전문기관으로 하여금 자원생산성 향상 및 지속가능한 자원관리에 관한 업무를 할 수 있도록 규정하고 있다. 이를 근거로 산업통상자원부는 한국생산기술연구원에 자원순환기술지원센터를 설립 운영하여 자원생산성에 관련한 연구를 지원해 오고 있다1).
자원생산성에 대한 기본적 개념은 오래전부터 그 중요성이 국내외적으로 인식되어 왔지만, 실질적으로 도입, 운영하는 과정에서 다양한 이견과 불확실성을 내포함으로써 지표의 신뢰성에 대한 우려도 제기되고 있다. 이러한 우려를 불식시키기 위해서는 자원생산성 관리지표에 대하여 전문가 및 기업 관계자 그리고 정책 담당자 등 다양한 관계자들의 의견 수렴을 통해 지표의 신뢰성을 제고하는 방안을 강구하여야 할 것이다.
자원생산성이란 국가 혹은 산업에서의 자원이 얼마만큼 효율적으로 이용되고 있는지를 나타내는 지표로서 투입된 자원을 이용하여 유발된 부가가치를 말한다2). 즉,
|
$$\mathrm{자원생산성}(\mathrm{Resource}\;\mathrm{productivity})\;=\frac{\mathrm{자원}\;투\mathrm{입으로부}터\;창출\mathrm 된\;\mathrm{부가가}치(\mathrm{Value}\;\mathrm{added})}{\mathrm{자원소비량}(\mathrm{DMC})}$$
| |
여기서 자원소비량(DMC)은 Fig. 1과 같이 도식화할 수 있다. 다시 말하면, 국내에서 채취한 자원과 수입량에서 수출량을 제외한 것을 말한다3).
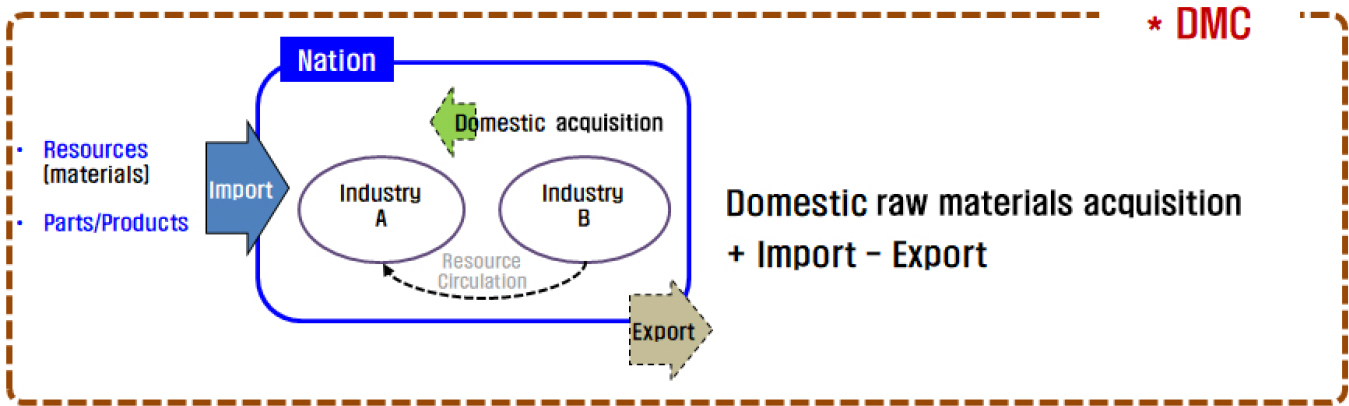
Fig. 1.
Definition of domestic resource consumption (DMC).
따라서 자원생산성은 생산과정에서의 자원사용 저감, 자원손실 및 부산물 배출 저감, 순환계에서의 재자원화(재생자원 이용) 촉진을 통해 향상을 기대할 수 있다(Fig. 2).
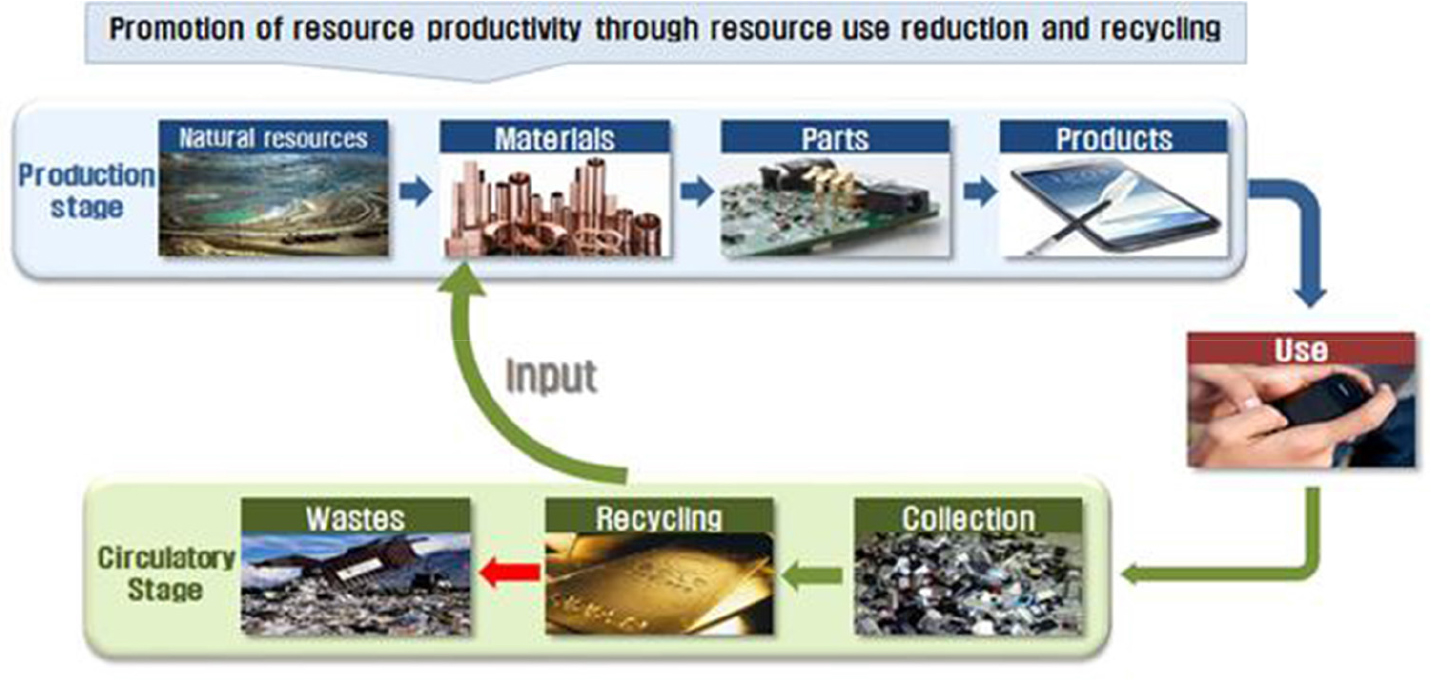
Fig. 2.
Sketch on the promotion of domestic resource productivity.
이에 본 논문에서는 국내외의 자원생산성 현황 및 관련 정책·연구동향을 조사·분석하여 시사점을 도출하고, 국내의 자원생산성 제고를 위한 방안을 제시하고자 한다.
2. 해외 주요국의 자원생산성 현황 및 정책 추진동향
2.1. 유럽에서의 자원생산성 관리 및 향상 정책
자원생산성 향상 및 관리는 자원사용 절감을 통한 지속가능한 발전을 실현할 수 있는 핵심 이슈이기 때문에 EU, OECD, UNEP 등 국제기구를 중심으로 다양한 정책을 추진해오고 있으며, 협의체 가동을 통한 국제적 협력도 병행해오고 있다. 그 핵심 내용을 요약하면 Table 1과 같다4,5).
Table 1.
Global management policies of resource productivity (RP)
|
Policy
|
Main contents
|
|
EU
|
6th Environmental
Action Plan
(2002~2012)
|
Strategies such as building natural resource data, developing indicators,
and establishing international committees to reduce
environmental impacts of resource use
and realize economic growth and decoupling of resource use
|
2011 Roadmap for
Resource Efficient Europe
|
Suggest the goals to be achieved by 2020 and the vision on the necessary structural and
technological changes by 2050 to continue
to use resources and reduce environmental impact
|
7th environmental
action plan
(2013~2020)
|
Establish policies for the transition to
a low-carbon economy that is resource-efficient and
has high green competitiveness
|
EU Resource Efficiency
Scoreboard (2015)
|
The EU publishes a Resource Efficiency Scoreboard
for evaluating resource efficiency improvement policies
for individual Member States and the EU as a whole.
|
|
OECD
|
Material flow
establishment and
resource productivity
calculation (2008)
|
Publication of guidelines to suggest concrete measures
for material flow (MF) and resource productivity (RP)
adopted by the OECD
|
Kobe 3R
Action Plan (2008)
|
Suggestion of 3 goals* which G8 countries(G7 at present) are to pursue
*Prioritizing 3R policies & improving resource productivity,
international cooperation to improve sound resource circulation,
and cooperation to develop 3R capabilities in developing countries
|
Policy guidelines
on resource efficiency
(2015)
|
Suggest the main resource management status,
policy trends and the main principles of
resource efficiency policy of G7 countries and OECD members
|
|
UNEP
|
UNEP-IRP
|
Organizing a committee to evaluate sustainable use
of natural resources and policies on environmental impact.
- Analysis of transition to a sustainable society, resource efficiency potential and
its economic effects
|
G7/8
Summit
|
The 34th
G8 Summit (2008)
|
Adopted and agreed on ‘Kobe 3R(Reduce, Reuse, Recycling) Action Plan’
- Promote efficient use of resources and waste through 3R(recycling, reduction, reuse),
and achieve the goal of harmonization between environment and economy
|
The 42nd
G7 Summit (2016)
|
Adopted Toyama Framework on Material Cycles
- Establish resource efficiency policy and
action plan based on Kobe 3R action plan and
resource efficiency-related G7 alliance
|
The 43rd
G20 Summit (2017)
|
Adopted ‘5-year Bologna Roadmap’
- Based on the G7 Alliance and the Toyama Framework,
the Bologna 5-year plan was adopted to promote common activities
to improve resource efficiency.
|
이와 함께 2000년대 들어 유럽의 각 국가별로도 자원생산성 향상을 위한 목표를 설정하고, 이를 달성하기 위한 다양한 정책들을 발표하고 추진해오고 있다(Tables 2 및 3).
Table 2.
Resource productivity targets in European countries
|
Nation
|
Resource productivity goals
|
|
Austria
|
∙50% increase in resource productivity in 2020 compared to 2009
∙4~10 times improvement by 2050
|
|
Estonia
|
∙10% increase in resource productivity in 2019 compared to 2015
|
|
France
|
∙30% increase in resource productivity in 2030 compared to 2010
|
|
Germany
|
∙Double the productivity of resources in 2020 compared to 1994
|
|
Hungary
|
∙80% reduction in resource intensity(DMC/GDP) in 2020 compared to 2007
|
|
Latvia
|
∙Resource productivity 540 EUR/ton in 2017, 600 EUR/ton in 2020, 710 EUR/ton in 2030
|
|
Poland
|
∙Resource productivity 450 EUR/ton in 2015, 500 EUR/ton in 2020
|
|
Portugal
|
∙170 EUR/ton in 2020, 720 EUR/ton in 2030
|
|
Slovenia
|
∙500 EUR/ton in 2023
|
Table 3.
Policies for promoting the resource productivity in European countries
|
Nation
|
Resource productivity improvement policy
|
|
Austria
|
∙National Resource Efficiency Action Plan and the RESET2020 initiative
- The 2012 Resource Efficiency Action Plan (REAP) has been refined and updated to REAP2020.
- Includes measures for resource-efficient production, public procurement, circular flow economy and awareness raising
|
|
Hungary
|
∙National Environmental Technology Innovation Strategy
- It aims to increase the share of renewable energy in power generation by 275%, and
reduce urban solid waste generation by 30%.
- The employment level of the environmental industry is aimed at twice the level of 2007
|
|
Latvia
|
∙Sustainable Development Strategy
- Includes comprehensive targets on a variety of topics related to material use, resource and energy efficiency
- Publish monitoring reports regularly and open to the public
|
|
Portugal
|
∙Green Growth Commitment (GGC)
- Includes specific targets such as improving energy efficiency, reducing public administration energy consumption,
reducing building energy consumption, and increasing waste recycling
|
2.2. 일본에서의 자원생산성 관리 및 향상 정책
일본은 2000년에 “순환형사회형성기본법” 제정을 통해 체계적으로 3R(Reduce, Reuse, Recycle)정책을 수립, 추진해 왔고, 자원생산성 목표도 설정하여 관리해 오고 있다(Table 4)6).
Table 4.
Policies for promoting the resource productivity in Japan
|
Indicators
|
1st basic circular plan
(Achieve a goal in 2010)
|
2nd basic circular plan
(Achieve a goal in 2015)
|
3rd basic circular plan
(Achieve a goal in 2020)
|
|
Resource productivity
|
390K ¥/ton
|
420K ¥/ton
|
460K ¥/ton
|
|
Recycled material utilization rate
|
14%
|
14~15%
|
17%
|
|
Waste disposal
|
28 mil. ton
|
23 mil. ton
|
17 mil. ton
|
자원생산성에 대한 지표 및 연구는 그 이전부터 수행되어 왔다. 일본에서는 자원생산성을 최종처분량 및 순환이용률과 함께 관리하고 있다. 이들 지표들의 연차별 변화 추이를 보면 Fig. 3과 같다.
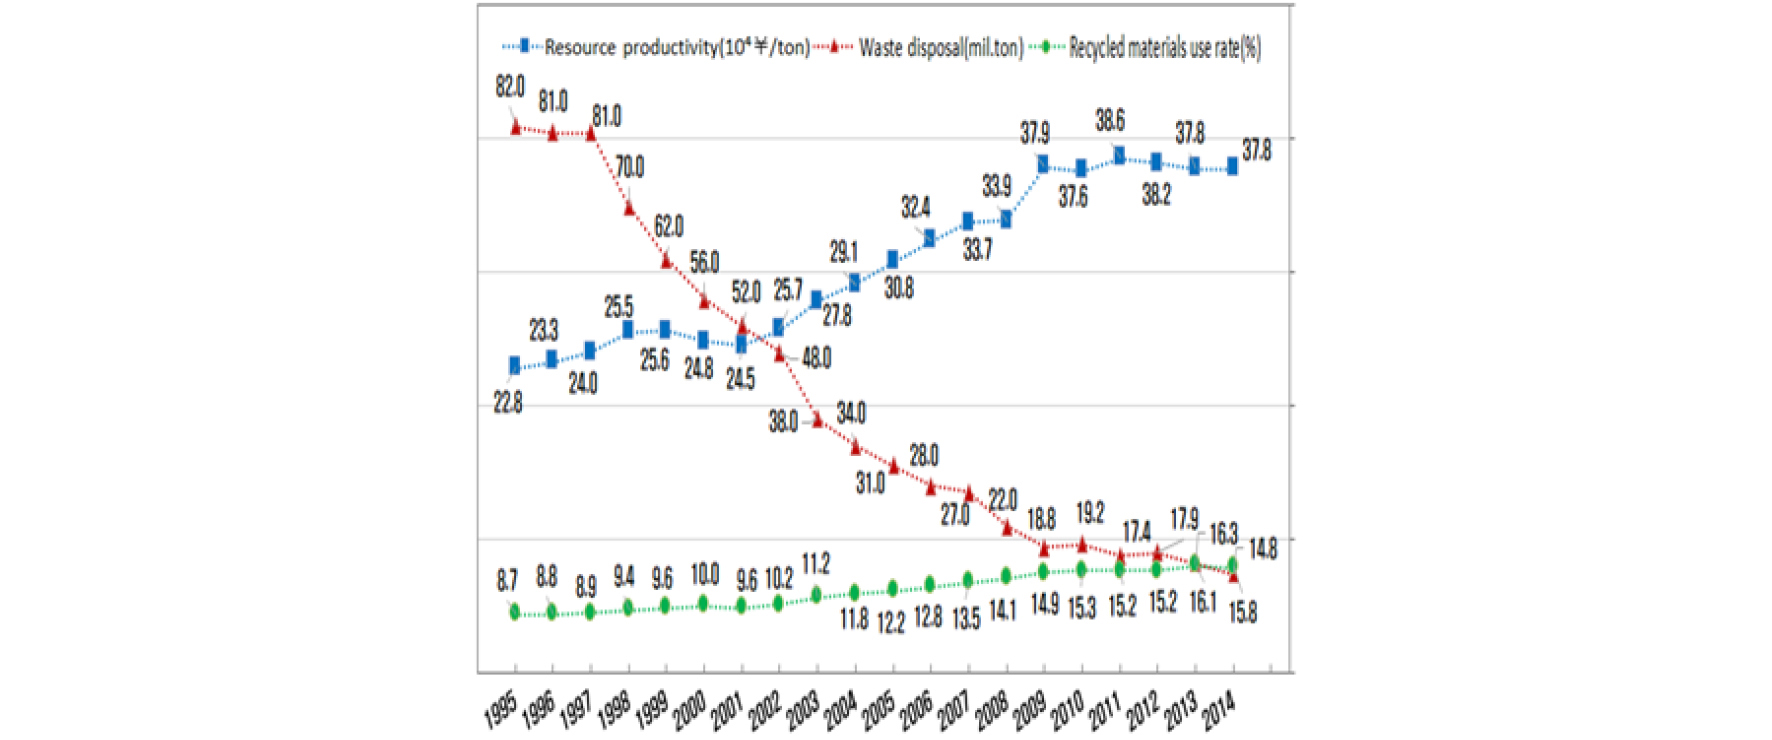
Fig. 3.
Resource productivity, waste disposal and recycled material utilization rate in Japan.
3. 자원생산성의 국내외 비교 분석
3.1. 국내의 자원생산성 산정
우리나라의 국가 단위 자원생산성 산정을 위해 가용 데이터의 현황 분석을 실시하였고, 국내 실정에 맞는 산정방법론을 정립하여 타 국가와의 비교분석을 수행하였다. 본 연구에서 제시하는 자원생산성 산정 절차는 Fig. 4와 같다.
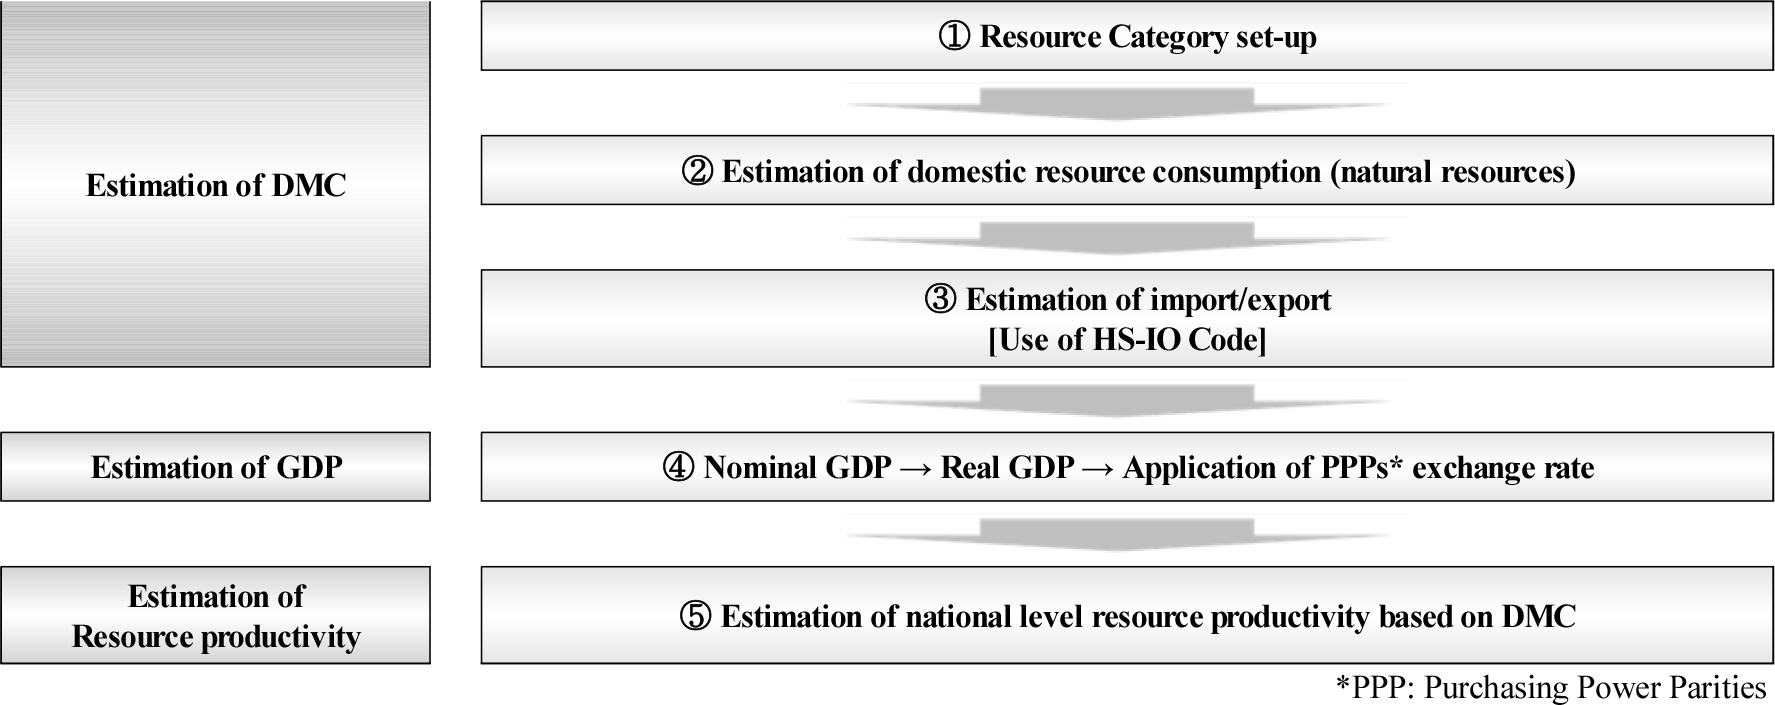
Fig. 4.
Procedure for estimating resource productivity.
국내의 자원생산성 산정을 위한 자원소비량 관련 통계현황을 살펴보면 Table 5와 같다7,8,9,10,11,12,13,14).
Table 5.
Domestic statistics related with resource consumption
|
Resource
|
Resources
based on IO Table
|
Domestic available statistics
|
Organization
|
Update
frequency
|
|
Coal
fuel
|
Hard coal
|
Mining and Mining Products Statistics
|
KIGAM
|
1 year
|
|
Bituminous coal
|
Energy Statistical Year Book
|
KEEI
|
1 year
|
|
Natural gas
|
|
Crude oil
|
|
Metal mineral
|
Iron stone
|
Mining and Mining Products Statistics
|
KIGAM
|
1 year
|
|
Copper ore
|
|
Lead and lead ore
|
|
Other nonferrous metal mineral
|
Non-
metal
mineral
|
Sand & pebble
|
Aggregate permit performance and
collection performance
|
MOLIT
|
1 year
|
|
Broken stone
|
|
Other construction stone
|
Mineral Products Supply and Demand Status
|
KIGAM
|
1 year
|
|
Limestone
|
Mining and Mining Products Statistics
|
|
Ceramics minerals
|
|
Raw salt
|
Statistics of the Korea Salt
Manufacture’s Association
|
Korea Salt
Manufacture’s Association
|
1 year
|
|
Other non-metal minerals
|
Mining and Mining Products Statistics
|
KIGAM
|
1 year
|
Food
resources
|
Rice
|
Statistical Yearbook of Agriculture, Food
and Rural Affairs
|
MAFRA,
National Statistical Office
|
1 year
|
|
Barley
|
|
Grain
|
|
Vegetable
|
|
Fruit
|
|
Bean
|
Statistical Yearbook of Agriculture, Food
and Rural Affairs
|
MAFRA,
National Statistical Office
|
1 year
|
|
Potato
|
|
Oilseed crop
|
|
Medicinal crop
|
Statistical Yearbook of Agriculture, Food
and Rural Affairs,
Yearbook of Forestry Statistics
|
|
Edible forest products
|
Yearbook of Forestry Statistics
|
|
Dairy
|
KOSIS
|
MAFRA,
National Statistical Office
|
1 year
|
|
Beef
|
KOSIS
|
|
Swine
|
KOSIS
|
|
Poultry
|
KOSIS
|
|
Other livestock
|
Statistical Yearbook of Agriculture,
Food and Rural Affairs
|
|
Fishery catch
|
Statistical Yearbook of
Maritime Affairs and Fisheries
|
National Statistical Office
|
1 year
|
|
Fish culture
|
Statistical Yearbook of
Maritime Affairs and Fisheries
|
|
Biomass
|
Fiber crops
|
Statistical Yearbook of Agriculture, Food and
Rural Affairs,
Yearbook of Forestry Statistics
|
Korea Forest Service,
National Statistical Office
|
1 year
|
|
Hard wood
|
Statistical Yearbook of Agriculture, Food and
Rural Affairs,
Yearbook of Forestry Statistics
|
|
Other forest products
|
Statistical Yearbook of Agriculture, Food and
Rural Affairs,
Yearbook of Forestry Statistics
|
다음은 HS-IO code를 이용한 자원 수출입량을 산정한 결과와 국내 자원투입량(DMI) 및 자원소비량(DMC) 산정결과를 Table 6에 나타내었다7,8,9,10,11,12,13,14).
Table 6.
Domestic input and consumption of resources
|
Year
|
Natural resource type
|
HS-CODE (1~99)
|
Product type
|
DMI*
|
DMC**
|
|
Production
|
Import
|
Export
|
Supply & demand
|
Total of import
|
Total of export
|
Import
|
Export
|
|
00‘
|
299,897
|
271,096
|
5,876
|
570,994
|
356,278
|
109,898
|
85,182
|
104,021
|
656,175
|
552,154
|
|
01‘
|
305,748
|
279,348
|
2,110
|
585,097
|
363,211
|
107,408
|
83,863
|
105,298
|
668,960
|
563,662
|
|
02‘
|
315,047
|
274,892
|
1,074
|
589,939
|
372,814
|
98,864
|
97,922
|
97,790
|
687,861
|
590,070
|
|
03‘
|
332,231
|
281,521
|
1,028
|
613,752
|
380,676
|
99,628
|
99,155
|
98,600
|
712,907
|
614,307
|
|
04‘
|
297,032
|
293,427
|
1,272
|
590,460
|
400,672
|
108,786
|
107,245
|
107,514
|
697,704
|
590,190
|
|
05‘
|
288,479
|
292,547
|
1,261
|
581,027
|
398,761
|
117,905
|
106,213
|
116,644
|
687,240
|
570,596
|
|
06‘
|
272,269
|
305,955
|
1,488
|
578,224
|
416,408
|
129,940
|
110,453
|
128,451
|
688,677
|
560,226
|
|
07‘
|
265,921
|
313,176
|
1,553
|
579,097
|
436,519
|
133,891
|
123,343
|
132,339
|
702,440
|
570,102
|
|
08‘
|
272,163
|
328,901
|
1,659
|
601,064
|
457,595
|
143,371
|
128,694
|
141,712
|
729,758
|
588,047
|
|
09‘
|
267,415
|
315,207
|
1,967
|
582,622
|
437,889
|
147,115
|
122,681
|
145,149
|
705,303
|
560,155
|
|
10‘
|
256,488
|
360,563
|
2,052
|
617,051
|
496,490
|
162,573
|
135,927
|
160,521
|
752,978
|
592,457
|
|
11‘
|
240,604
|
393,102
|
2,559
|
633,706
|
527,426
|
183,563
|
134,325
|
181,003
|
768,031
|
587,027
|
|
12‘
|
240,730
|
394,769
|
2,783
|
635,499
|
533,448
|
188,552
|
138,679
|
185,769
|
774,178
|
588,409
|
|
13‘
|
260,481
|
393,844
|
2,903
|
654,324
|
535,304
|
184,865
|
141,460
|
181,962
|
795,784
|
613,822
|
|
14‘
|
255,811
|
406,483
|
3,045
|
662,294
|
555,650
|
191,390
|
149,167
|
188,344
|
811,461
|
623,117
|
|
15‘
|
274,852
|
419,606
|
3,045
|
694,458
|
565,845
|
195,023
|
146,239
|
191,978
|
840,697
|
648,719
|
|
16‘
|
275,390
|
424,539
|
3,422
|
699,929
|
579,192
|
194,683
|
154,653
|
191,260
|
854,582
|
663,322
|
*DMI : Domestic raw materials acquisition + Natural resources input + Product type import
**DMC : DMI – Natural resources export – Product type export
Table 6을 바탕으로 국내의 명목 GDP를 실질 GDP로 환산하여 자원생산성을 산정한 결과는 Table 7과 같다. 2016년의 자원생산성은 DMC 기준 2.27로서 전년 대비 0.56% 향상되었음을 보여주고 있다. 자원생산성은 2013년 이후로는 증가와 하락을 반복하는 경향을 보이고 있으나, 대체로 꾸준히 증가하는 우상향 추세를 보여주고 있다.
Table 7.
Domestic resource productivity
|
Year
|
DM
(K ton)
|
DMC
(K ton)
|
GDP (Billion won)*
|
Resource productivity
(mil. won / ton)
|
Increase/decrease
|
|
Nominal
|
GDP Deflator
|
Real
|
GDP/DMI
|
GDP/DMC
|
GDP/DMI
|
GDP/DMC
|
|
00‘ |
656,175
|
552,154
|
635,185
|
77
|
820,843
|
1.25
|
1.49
|
-
|
-
|
|
01‘ |
668,960
|
563,662
|
688,165
|
80
|
857,986
|
1.28
|
1.52
|
2.53%
|
2.39%
|
|
02‘ |
687,861
|
590,070
|
761,939
|
83
|
921,763
|
1.34
|
1.56
|
4.48%
|
2.63%
|
|
03‘ |
712,907
|
614,307
|
810,915
|
85
|
948,794
|
1.33
|
1.54
|
-0.68%
|
-1.13%
|
|
04‘ |
697,704
|
590,190
|
876,033
|
88
|
995,289
|
1.43
|
1.69
|
7.19%
|
9.19%
|
|
05‘ |
687,240
|
570,596
|
919,797
|
89
|
1,034,340
|
1.51
|
1.81
|
5.51%
|
7.49%
|
|
06‘ |
688,677
|
560,226
|
966,055
|
89
|
1,087,875
|
1.58
|
1.94
|
4.96%
|
7.12%
|
|
07‘ |
702,440
|
570,102
|
1,043,258
|
91
|
1,147,307
|
1.63
|
2.01
|
3.40%
|
3.64%
|
|
08‘ |
729,758
|
588,047
|
1,104,492
|
94
|
1,179,774
|
1.62
|
2.01
|
-1.02%
|
-0.31%
|
|
09‘ |
705,303
|
560,155
|
1,151,708
|
97
|
1,188,124
|
1.68
|
2.12
|
4.20%
|
5.72%
|
|
10‘ |
752,978
|
592,457
|
1,265,308
|
100
|
1,265,308
|
1.68
|
2.14
|
-0.25%
|
0.69%
|
|
11‘ |
768,031
|
587,027
|
1,332,681
|
102
|
1,311,888
|
1.71
|
2.23
|
1.65%
|
4.64%
|
|
12‘ |
774,178
|
588,409
|
1,377,457
|
103
|
1,341,962
|
1.73
|
2.28
|
1.48%
|
2.05%
|
|
13‘ |
795,784
|
613,822
|
1,429,445
|
104
|
1,380,826
|
1.74
|
2.25
|
0.10%
|
-1.36%
|
|
14‘ |
811,461
|
623,117
|
1,486,079
|
104
|
1,426,974
|
1.76
|
2.29
|
1.35%
|
1.80%
|
|
15‘ |
840,697
|
648,719
|
1,564,124
|
107
|
1,466,788
|
1.74
|
2.26
|
-0.78%
|
-1.27%
|
|
16‘ |
854,582
|
663,322
|
1,637,421
|
109
|
1,508,268
|
1.76
|
2.27
|
1.16%
|
0.56%
|
*Year 2010 based GDP (From the Bank of Korea)
하지만 2000년 대비 2016년의 자원생산성은 53% 증가하는 긍정적인 모습을 보여주고 있으나, 이는 이 기간 동안 GDP 84% 성장이라는 상대적으로 더 큰 요인에 의하여 향상된 결과로 분석된다. 자원소비량은 이 기간 동안 오히려 20% 증가하는 양상을 보임으로써 서구 선진국의 패턴과 같은 GDP와 자원소비량의 관계가 디커플링(Decoupling)화하는데 실패했다고 할 수 있다. 결국 그동안 국내의 환경∙자원순환 관련 법규, 제도 등을 충실히 수립하고 운영해 왔음에도 불구하고 자원생산성 제고에는 아직까지 실효적이지 못했음을 본 데이터를 통해 입증하고 있다(Fig. 5).
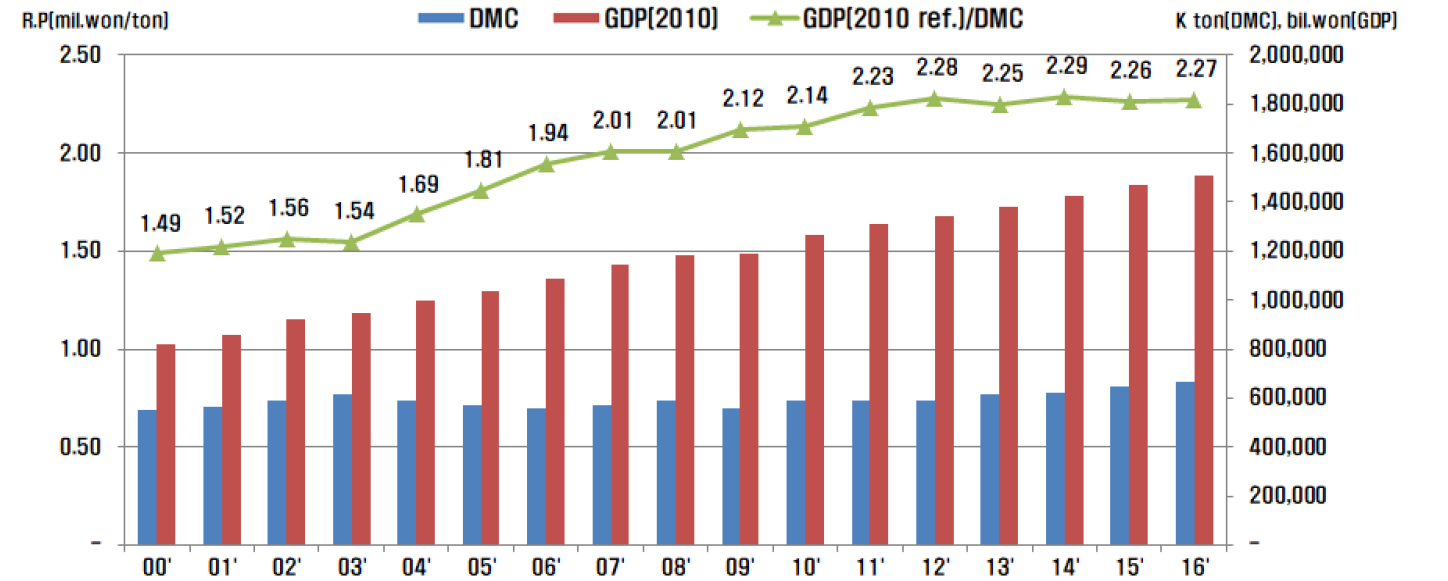
Fig. 5.
Relationship between resource productivity, resource consumption and GDP of Korea.
3.2. 해외 주요국의 자원생산성과 우리나라의 자원생산성 비교
우선 국가별 자원소비량을 비교해 보면 Table 8과 같다. 주목해야 할 부분은 캐나다를 제외한 G7 국가는 모두 자원소비량이 감소하는 추세에 있는 반면, 우리나라는 지속적으로 증가하는 양상을 보여주고 있다.
Table 8.
Resource consumptions of advanced major countries and Korea (unit: k ton)4,15)
|
Year
|
Korea
|
OECD G7
|
|
USA1) |
Canada1) |
Japan1) |
Germany2) |
France2) |
Italy2) |
UK2) |
|
05
|
570,596
|
8,770,391
|
982,612
|
1,451,651
|
1,302,310
|
857,003
|
864,634
|
732,627
|
|
06
|
560,226
|
8,621,800
|
972,053
|
1,461,240
|
1,336,747
|
875,982
|
875,337
|
723,965
|
|
07
|
570,102
|
8,170,843
|
958,673
|
1,451,632
|
1,337,379
|
911,556
|
832,046
|
718,818
|
|
08
|
588,047
|
7,646,075
|
1,017,951
|
1,384,035
|
1,327,982
|
892,512
|
805,229
|
675,046
|
|
09
|
560,155
|
6,806,650
|
836,876
|
1,232,621
|
1,264,749
|
798,543
|
723,926
|
592,934
|
|
10
|
592,457
|
6,914,401
|
972,337
|
1,264,751
|
1,264,837
|
784,233
|
681,717
|
576,945
|
|
11
|
587,027
|
6,849,657
|
1,004,444
|
1,259,396
|
1,367,754
|
807,766
|
661,007
|
582,117
|
|
12
|
588,409
|
6,222,206
|
988,859
|
1,265,201
|
1,322,655
|
784,974
|
560,316
|
563,432
|
|
13
|
613,822
|
6,441,032
|
1,083,241
|
1,247,961
|
1,313,305
|
786,576
|
489,359
|
570,169
|
|
14
|
623,117
|
6,488,492
|
1,045,885
|
1,213,204
|
1,362,504
|
774,731
|
421,475
|
591,385
|
|
15
|
648,719
|
6,340,090
|
1,043,020
|
1,185,475
|
1,284,704
|
746,120
|
421,800
|
576,278
|
|
16
|
663,322
|
6,186,884
|
1,048,726
|
1,162,665
|
1,279,122
|
727,806
|
425,135
|
570,343
|
*Source: 1) Environment live, UNEP 2) Eurostat, European commission
국가별 GDP를 비교해보면 Table 9와 같다. 2005년 대비 2016년 OECD 전체 국가들의 GDP 증가율은 18%인데 반해 우리나라의 GDP 증가율은 46%로 OECD 평균의 약 2.6배이다. 우리나라의 GDP 증가율이 상대적으로 매우 크다는 것을 보여주고 있다.
Table 9.
GDPs of advanced major countries (G7) and Korea (unit: million dollar)16)
|
Year
|
Korea
|
OECD total
|
OECD G7
|
|
USA
|
Canada
|
Japan
|
Germany
|
France
|
Italy
|
UK
|
|
05
|
1,230,520
|
41,538,424
|
14,408,094
|
1,286,111
|
4,460,636
|
3,019,778
|
2,254,547
|
2,112,136
|
2,216,280
|
|
06
|
1,294,214
|
42,824,975
|
14,792,304
|
1,319,851
|
4,523,978
|
3,131,515
|
2,308,091
|
2,154,518
|
2,270,712
|
|
07
|
1,364,922
|
43,934,047
|
15,055,396
|
1,347,076
|
4,598,813
|
3,233,619
|
2,362,597
|
2,186,273
|
2,324,226
|
|
08
|
1,403,539
|
44,039,114
|
15,011,490
|
1,360,551
|
4,548,523
|
3,268,617
|
2,367,211
|
2,163,308
|
2,313,243
|
|
09
|
1,413,469
|
42,510,122
|
14,594,843
|
1,320,421
|
4,302,156
|
3,084,958
|
2,297,583
|
2,044,714
|
2,216,370
|
|
10
|
1,505,299
|
43,776,711
|
14,964,372
|
1,361,136
|
4,482,491
|
3,210,822
|
2,342,745
|
2,079,199
|
2,253,927
|
|
11
|
1,560,719
|
44,670,249
|
15,204,020
|
1,403,892
|
4,477,317
|
3,328,338
|
2,391,456
|
2,091,188
|
2,286,668
|
|
12
|
1,596,497
|
45,257,210
|
15,542,161
|
1,428,397
|
4,544,257
|
3,344,714
|
2,395,825
|
2,032,237
|
2,320,542
|
|
13
|
1,642,735
|
45,936,755
|
15,802,855
|
1,463,750
|
4,635,155
|
3,361,089
|
2,409,631
|
1,997,117
|
2,368,168
|
|
14
|
1,697,626
|
46,941,609
|
16,208,861
|
1,505,551
|
4,652,523
|
3,425,947
|
2,432,465
|
1,999,387
|
2,440,498
|
|
15
|
1,744,994
|
48,148,482
|
16,672,692
|
1,520,619
|
4,715,510
|
3,485,669
|
2,458,430
|
2,019,334
|
2,497,750
|
|
16
|
1,794,338
|
49,011,803
|
16,920,328
|
1,542,123
|
4,759,751
|
3,553,417
|
2,487,628
|
2,038,364
|
2,543,666
|
*GDP: Constant prices (Real GDP based), PPPs, *Source: OECD
국가별 자원소비량과 GDP 자료가 확보되면 자원생산성 산정이 가능하므로 상기 국가들에 대한 자원생산성 산정 결과를 Table 10에 나타내었다. 국가별 자원생산성의 변화 추이는 Fig. 6과 같다.
Table 10.
Resource Productivity of advanced major countries and Korea17,18,19,20)
|
Year
|
Korea
|
USA
|
Canada
|
Japan
|
Germany
|
France
|
Italy
|
UK
|
|
05‘
|
2.16
|
1.64
|
1.31
|
3.07
|
2.32
|
2.63
|
2.44
|
3.03
|
|
06‘
|
2.31
|
1.72
|
1.36
|
3.10
|
2.34
|
2.63
|
2.46
|
3.14
|
|
07‘
|
2.39
|
1.84
|
1.41
|
3.17
|
2.42
|
2.59
|
2.63
|
3.23
|
|
08‘
|
2.39
|
1.96
|
1.34
|
3.29
|
2.46
|
2.65
|
2.69
|
3.43
|
|
09‘
|
2.52
|
2.14
|
1.58
|
3.49
|
2.44
|
2.88
|
2.82
|
3.74
|
|
10‘
|
2.54
|
2.16
|
1.40
|
3.54
|
2.54
|
2.99
|
3.05
|
3.91
|
|
11‘
|
2.66
|
2.22
|
1.40
|
3.56
|
2.43
|
2.96
|
3.16
|
3.93
|
|
12‘
|
2.71
|
2.50
|
1.44
|
3.59
|
2.53
|
3.05
|
3.63
|
4.12
|
|
13‘
|
2.68
|
2.45
|
1.35
|
3.71
|
2.56
|
3.06
|
4.08
|
4.15
|
|
14‘
|
2.72
|
2.50
|
1.44
|
3.83
|
2.51
|
3.14
|
4.74
|
4.13
|
|
15‘
|
2.69
|
2.63
|
1.46
|
3.98
|
2.71
|
3.29
|
4.79
|
4.33
|
|
16‘
|
2.71
|
2.73
|
1.47
|
4.09
|
2.78
|
3.42
|
4.79
|
4.46
|
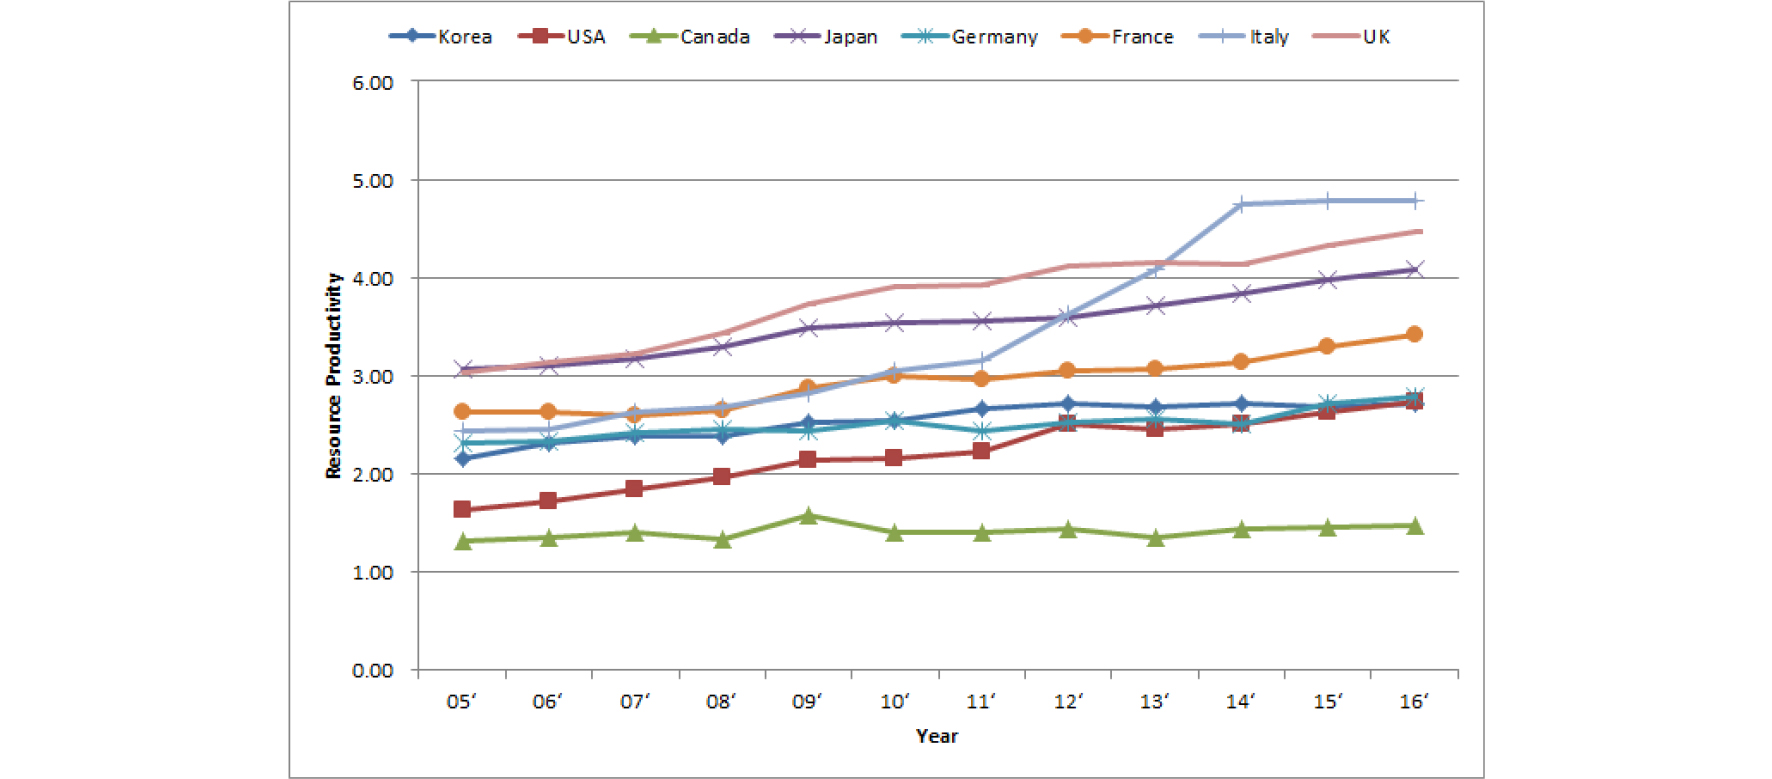
Fig. 6.
Trends of resource productivities of advanced major countries and Korea from year 2005 to 2016.
우리나라의 자원생산성은 G7 국가들의 평균에 비해 약간 못 미치는 수준으로서 표면적으로는 자원생산성 관리가 어느 정도 잘 되고 있는 것으로 평가할 수 있다. 하지만 그 내용을 들여다 보면 자원소비량의 감축에 기인한 결과가 아니라 GDP의 성장률이 상대적으로 매우 높게 나타났기 때문에 이러한 효과를 얻을 수 있었던 것이다. 대체로 유럽 국가들의 자원소모량은 2008년 이후 지속적으로 감소하고 있는 반면에 우리나라는 계속 증가하는 추세에 있기 때문에 유럽 28개국처럼 자원소모량(DMC)과 GDP의 디커플링이 이루어지지 않고 있는 것이 문제점으로 지적될 수 있으며, 이는 자원생산성 관리를 위해 향후 해결해 나가야 할 핵심 과제이다.
유럽의 경우 조금 더 확대해서 살펴보면, EU 28개국의 자원생산성은 2000년 대비 2016년의 자원생산성이 41% 증가한 것으로 분석되고 있다. 이 기간 동안 GDP는 23% 증가한 반면, DMC(자원소비량)는 13% 감소한 것으로 나타남으로써 자원관리의 이상적 패턴인 디커플링(Decoupling)이 실현되는 모습을 보여주고 있다(Fig. 7). 이는 2008년 이후 건축자재 부문의 재활용 확대로 인한 신규 자원(천연자원)의 투입 감소가 큰 원인으로 해석된다.
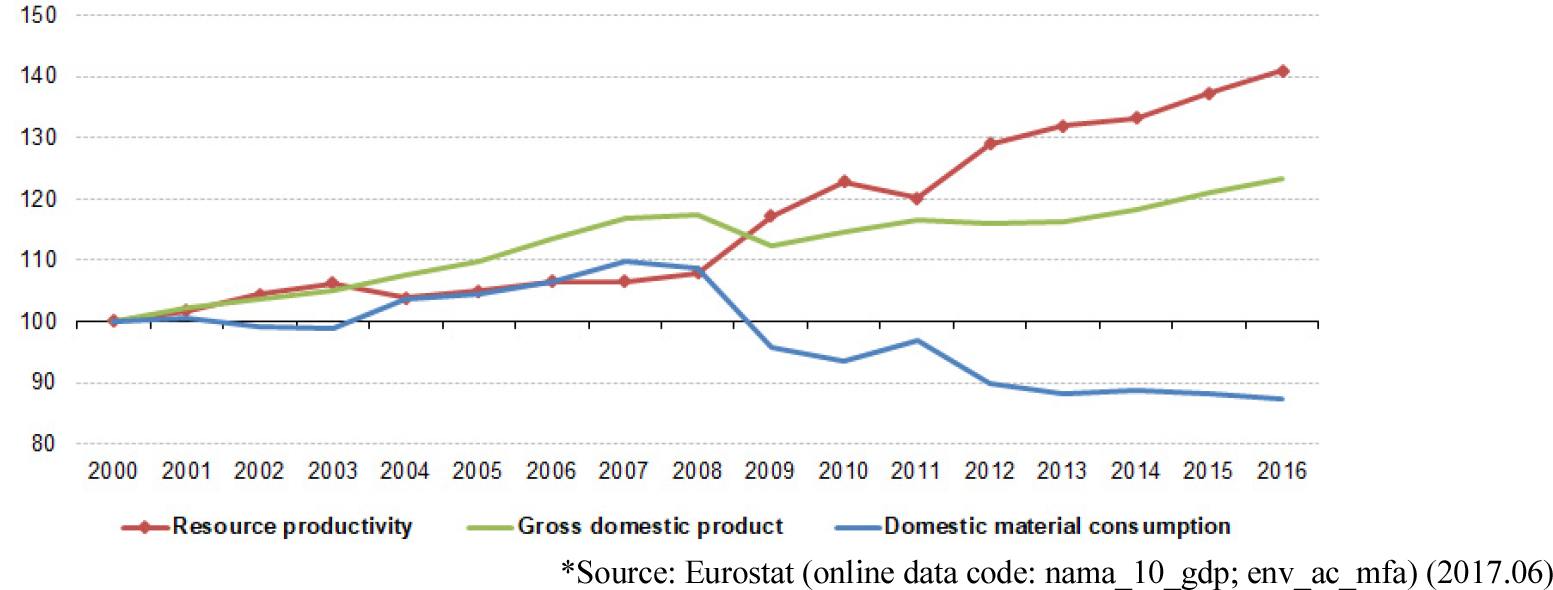
Fig. 7.
Trends of resource productivities, GDP and DMC of EU-28 countries from year 2000 to 201617,18,19,20).
4. 우리나라의 자원생산성 제고 방안
지금까지 자원생산성에 대한 해외 사례와 우리나라의 실태를 조사, 비교 분석하였는데, 이로부터 도출된 시사점을 바탕으로 향후 우리나라의 자원생산성을 향상시킬 수 있는 방안을 다음과 같이 제안하고자 한다.
1) 우선 제도적 측면의 개선방안을 살펴보면 자원생산성 지표의 체계적, 지속적 관리를 위한 기존 통계구축체계의 개선 및 추가적 신규 통계구축을 통한 통계의 신뢰도 제고를 들 수 있다. 분야별 통계구축체계 개선을 위한 분석사례를 도식화하면 Fig. 8과 같이 나타낼 수 있다. 다시 말하면, 자원생산성 관리를 위한 필요 통계를 우선 도출하여 기존 통계구축 유무 파악, 통계형태 분석 등을 통해 향후 통계구축 및 운영체계에 대한 종합적 개선계획이 마련되어야 할 것이다.
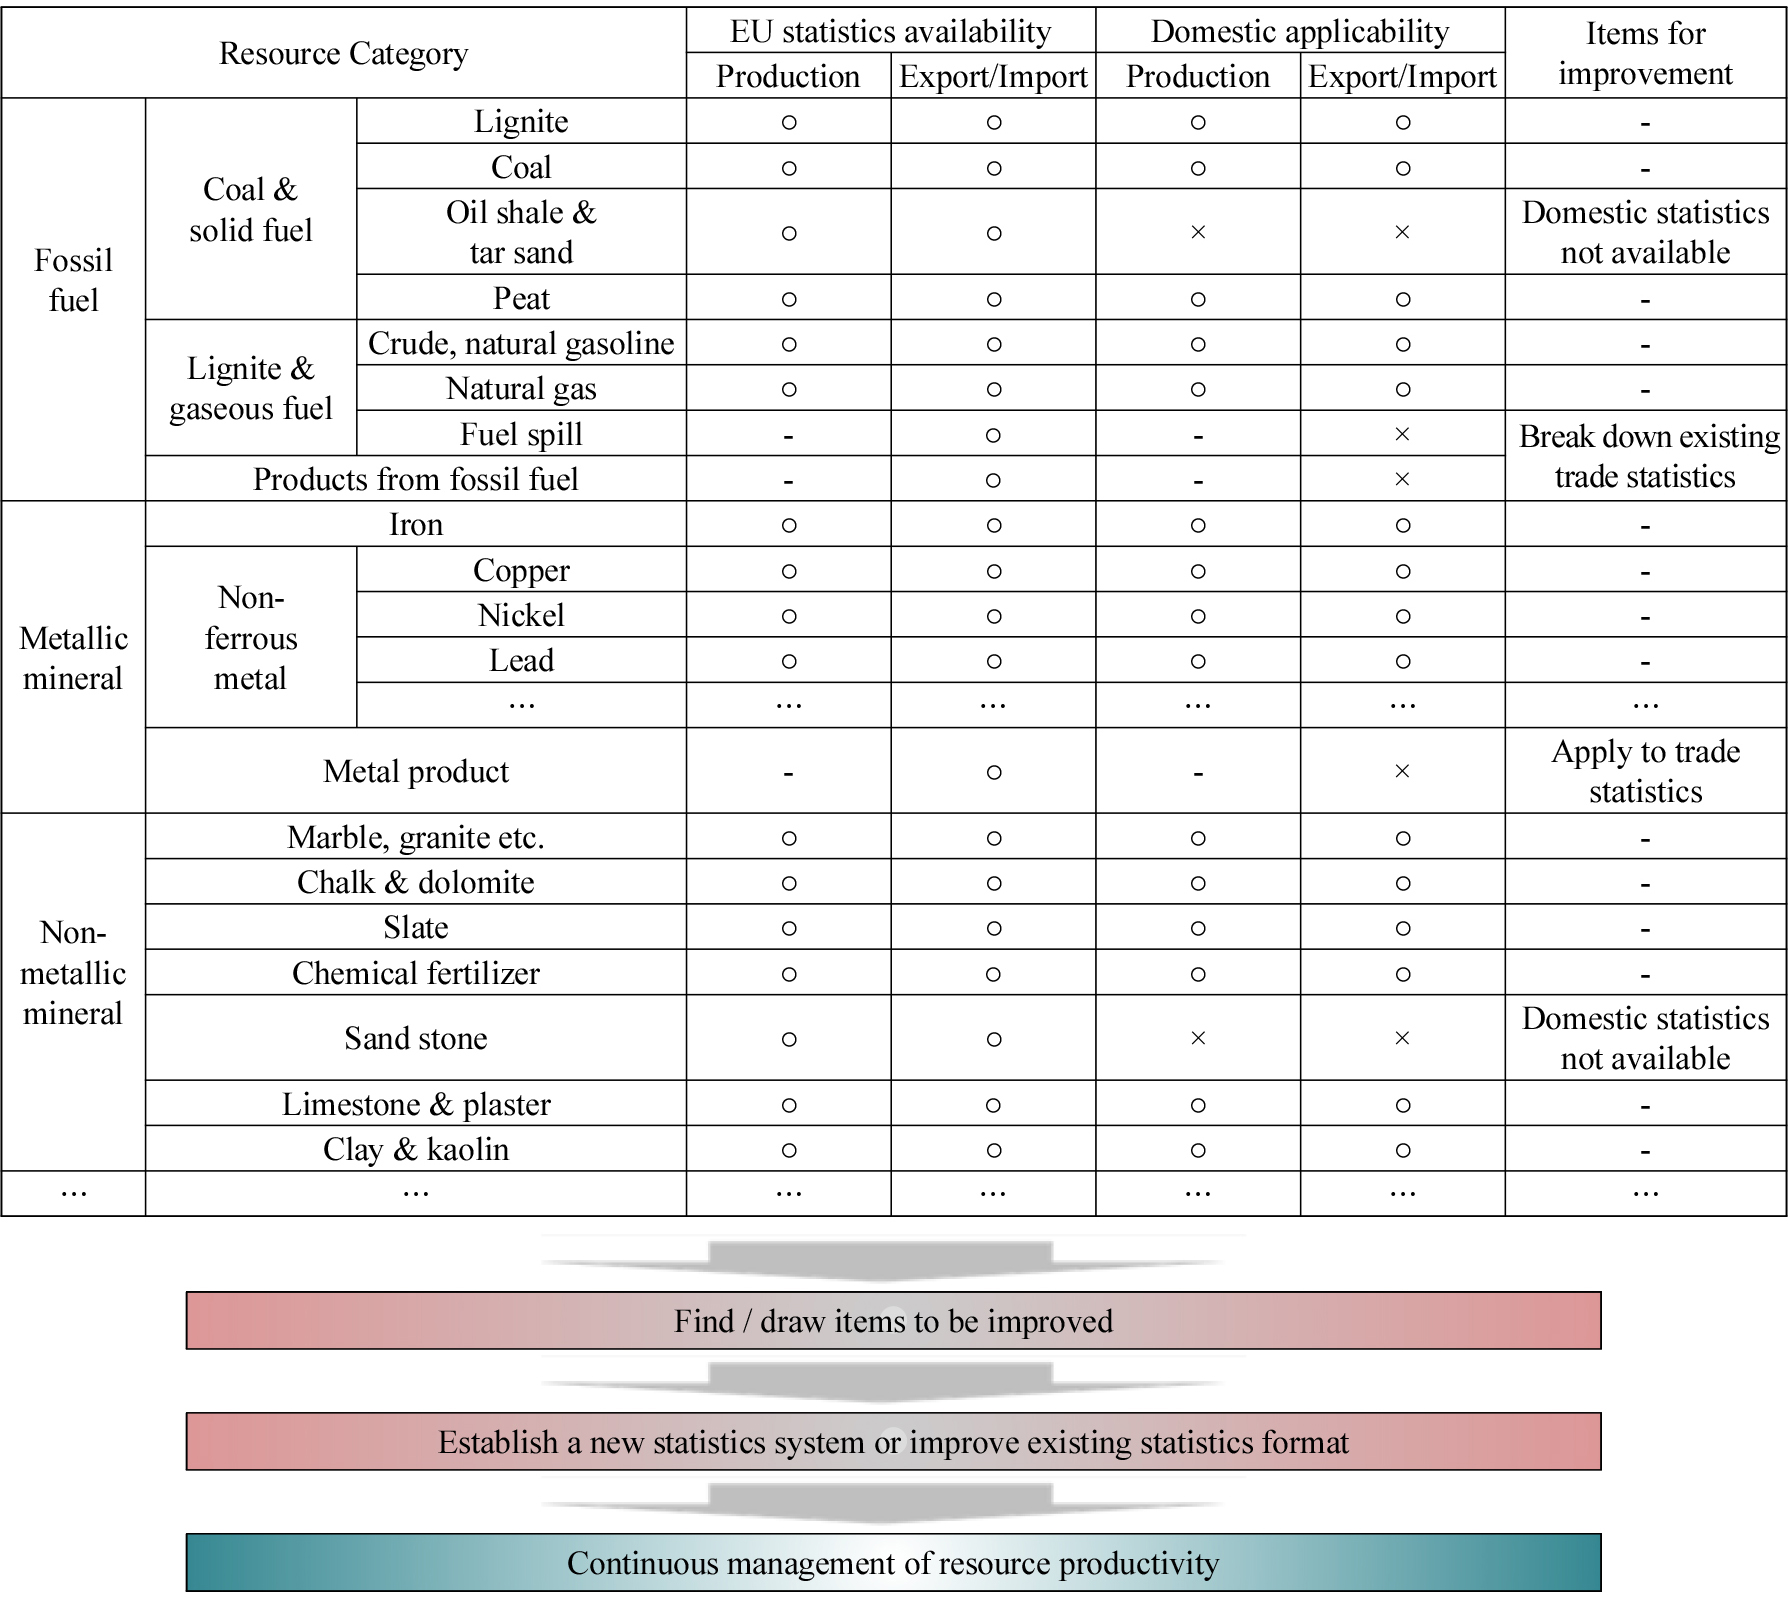
Fig. 8.
Suggestion for improving domestic resource productivity in the national systematic aspect.
2) 산업 단위의 자원생산성 관리를 위한 체계 구축이 필요하다. 이에 대한 사전 연구를 위해 우리나라의 산업별 자원생산성 현황을 우선 조사 분석하였는데, 그 결과는 Fig. 9와 같다. 이는 산업간 비교를 목적으로 하는 것이 아니다. 자원생산성은 각 산업의 독특한 특성이 있기 때문에 산업간 단순 비교를 하는 것은 큰 의미가 없다. 산업의 특성상 에너지나 자원을 상대적으로 많이 쓸 수밖에 없는 업종이 있는가 하면 그렇지 않은 업종도 있기 때문이다. 따라서 산업간 자원생산성 비교를 통한 개선방안 마련은 실효성이 별로 없다고 할 수 있다. 이에 산업별 특성을 상세하게 이해하고 그 산업특성에 맞는 자원관리 정책수립이 이루어져야 하고, 지원예산 배분도 이에 따라 함께 수반되어야 할 것이다. 현재의 국가 통계체계에서는 산업별 자원생산성, 경제성(자원투입량, 부가가치 등), 환경성(연간 폐기물 발생량, 온실가스 발생량 등) 등에 대한 세분화된 통계를 얻기가 힘든 상황이므로 산업 단위의 자원생산성 관리를 위해서는 이와 같은 기본 체계가 마련되어야 현황분석을 통한 제대로 된 개선방안이 도출될 수 있을 것이다.
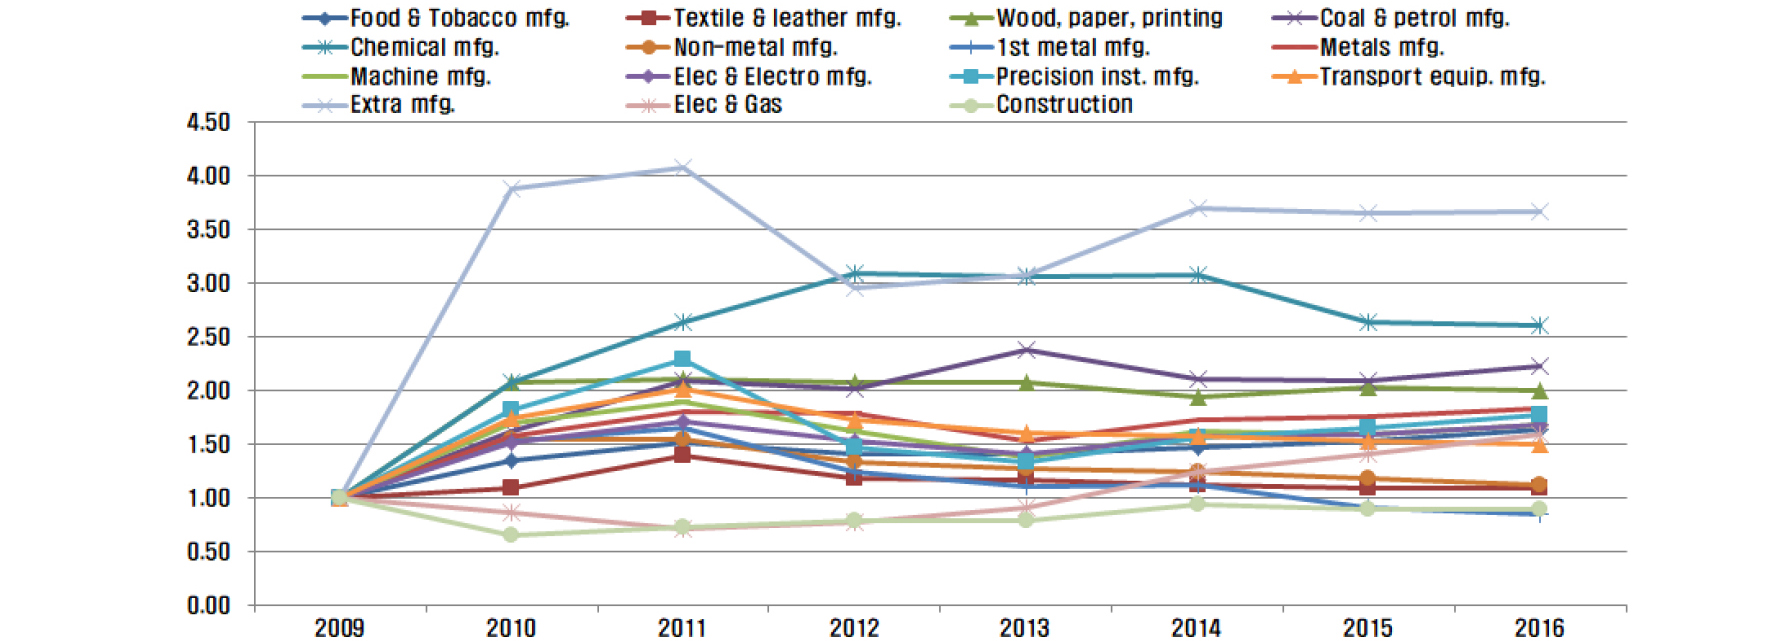
Fig. 9.
Resource productivities in 15 industrial sectors of Korea.
3) 자원생산성 목표관리제 운영이 필요하다. 자원생산성 목표관리제도는 강제적 감축목표를 설정하여 할당하거나 규제하는 방식이 아닌 자발적 참여에 의한 인센티브제를 도입하는 형식이 바람직할 것이다. 국가 차원의 추진과 지원제도가 있을 수 있고, 지자체의 참여를 통해 운영하는 방안도 고려해 볼 수 있다. 자원생산성 또는 자원효율성을 제고하는 사업에 참여하거나 아니면 자체적으로 일정 수준 이상의 자원생산성 향상을 달성한 업체에 대한 적절한 인센티브를 제공하는 시스템을 갖추는 것이 중요하다. 많은 기업들의 참여를 유도하기 위해서는 자원생산성 사업 참여를 통한 단순한 인센티브 수혜에 대한 홍보도 중요하지만, 기업들이 이 사업에 참여함으로써 실질적으로 기업의 생산활동 또는 경영활동에서 자원 및 에너지절감, 생산 및 경영의 효율향상(경영성과)을 이룰 수 있다는 확신을 가질 수 있는 성공사례를 많이 발굴, 제공하여야 할 것이다.
5. 결론 및 제언
본 연구를 통해 도출된 결과에 따르면 우리나라의 2000년 대비 2016년의 자원생산성은 53% 증가하는 긍정적인 모습을 보여주고 있어 EU-28개 국가들의 평균 자원생산성 증가율 41%에 비해 표면상으로는 더 나은 것으로 보일 수 있다. 이는 자원의 효율적 사용에 기인한 성과가 아니라 우리나라의 GDP 성장률이 이 기간 동안 84%인 반면, EU-28개 국가들의 평균 GDP 성장률은 23%에 그치고 있기 때문에 이러한 결과를 나타내고 있는 것으로 분석된다. 중요한 사실은 EU-28개 국가들의 자원소비량(DMC)이 이 기간 동안 13% 감소할 때 우리나라의 자원소비량은 오히려 20% 증가하는 양상을 보여주고 있다는 것이다. 즉, 유럽 국가들의 자원소모량은 2008년 이후 지속적으로 감소하고 있는 반면에 우리나라는 계속 증가하는 추세에 있기 때문에 유럽 28개국에서는 자원소모량(DMC)과 GDP의 디커플링이 이루어지고 있지만, 우리나라는 그러한 패턴을 나타내지 못하고 DMC와 GDP가 동조화 현상을 보여주고 있다. 이는 유럽과 한국의 산업적 특성이 다른 측면에 의해서도 어느 정도 영향을 받을 수 있겠지만, 향후 DMC와 GDP의 디커플링화를 실현할 수 있는 제도 마련과 정책 추진을 지속해 나가야 할 것이다.
자원생산성의 지속적 향상을 위해서는 우선적으로 자원생산성 관리지표가 합리적, 객관적으로 설정되어야 할 것이다. 주요 지표 및 세부 보조 지표들이 전문가, 기업 담당자 및 관계 부처의 합의를 통해 구체화되어야 할 것이다. 국가 단위, 산업 단위, 기업 단위의 관리 기준이 함께 제시되어야 할 것이다. 관리지표가 세부적으로 마련되면 본문에서 상술한 바와 같이 1) 자원생산성 지표의 체계적, 지속적 관리를 위한 기존 통계구축 체계의 개선 및 추가적 신규 통계구축, 2) 산업별 특성을 상세하게 이해하고 그 산업특성에 맞는 자원관리 정책수립, 3) 자원생산성 목표관리제 운영 및 인센티브 제도 도입을 통한 기업들의 적극적 참여 유도가 이루어져야 할 것이다.
Acknowledgements
본 연구의 일부는 산업통상자원부의 “자원생산성 기반구축사업” 지원으로 수행되었습니다. 자료수집 및 정리에 도움을 준 한국생산기술연구원의 이일석 박사, 조현정 박사, 김경환 연구원에게 고마움을 전합니다.
References
Kang, H.Y., 2017 : Final report for the establishment of resource productivity infrastructure, Presentation material, p.8.
IL-Seuk Lee, Hong-Yoon Kang, Kyung-Hwan Kim, et al., 2014 : A suggestion for Korean resource productivity management policy with calculating and analyzing its national resource productivity, Resources, Conservation and Recycling, 91, pp.40-51.
Kang, H.Y., Lee, I.S. and Kim, K.H., 2018 : Status of domestic resource productivity and its implication, Proc. Korea Environmental Management Association, Summer Conference Held in Hilton Kyungju, pp.1-12.
UNEP Environment live (https://environmentlive.unep.org/downloader).
UNEP, 2017 : RESOURCE EFFICIENCY- POTENTIAL AND ECONOMIC IMPLICATIONS.
Stat.kita.net, 2000-2016.
ecos.bok.or.kr, 2000-2016.
price.bok.or.kr, 2000-2016.
http://www.molit.go.kr, 2000-2016.
http://uni.agrix.go.kr, 2000-2016.
http://www.ksalt.or.kr, 2000-2016.
http://forest.go.kr, 2000-2016.
http://mici.kigam.re.kr, 2000-2016.
Eurostat : 2017 (online data code: nama_10_gdp; env_ac_mfa).
OECD GDP data (https://data.oecd.org/gdp/gross-domestic-product-gdp.htm).
UNEP, 2017 : ASSESSING GLOBAL RESOURCE USE.
UNEP, 2016 : GLOBAL MATERIAL FLOWS AND RESOURCE PRODUCTIVITY.
OECD, 2016 : Policy Guidance on Resource Efficiency
Eurostat resource productivity statistics : (http://ec.europa.eu/eurostat/statistics-explained/index.php/Resource_productivity_statistics).


